机器学习算法---K-means算法
下周二算法课需要讲一个算法PPT,趁着自己在学习大数据,最佳的算法选择方向无疑是机器学习了。除了K-means我还接触过KNN以及反向传播神经网络。等到后面在系统学习复习(开天辟地)的时候再做一个详细的梳理。
K-means
K-means算法是硬聚类算法,是典型的基于原型的目标函数聚类方法的代表,它是数据点到原型的某种距离作为优化的目标函数,利用函数求极值的方法得到迭代运算的调整规则。K-means算法以欧式距离作为相似度测度,它是求对应某一初始聚类中心向量V最优分类,使得评价指标J最小。算法采用误差平方和准则函数作为聚类准则函数。
算法使用小案例
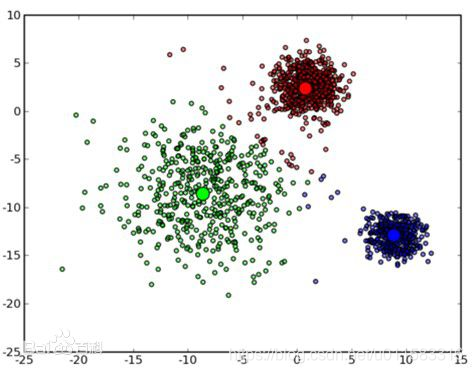
假设有一批人的年龄的数据,大致知道其中有一堆少年儿童,一堆青年人,一堆老年人。.
聚类就是自动发现这三堆数据,并把相似的数据聚合到同一堆中。所以对于这个例子,如果要聚成3堆的话,那么输入就是一堆年龄数据,注意,此时的年龄数据并不带有类标号,也就是说我只知道里面大致有三堆人,至于谁是哪一堆,现在是不知道的,而输出就是每个数据所属的类标号,聚类完成之后,就知道谁和谁是一堆了。
什么叫聚类?
聚类的目标:将一组向量分成若干组,组内数据是相似的,而组间数据是有较明显差异。
与分类区别:分类与聚类最大的区别在于分类的目标事先已知,聚类也被称为无监督机器学习
K 是什么?
K是聚类算法中当前类的个数
Means 是什么?
means是均值算法
算法描述:
算法核心很简单,我感觉K打头的算法都挺简单的。相信你看了也会对机器学习充满自信。
- 任选K个点作为初始聚类中心
- 根据每个聚类的中心,计算每个对象与这些中心的距离,并根据最小距离重新对对象进行划分
- 重新计算每个聚类的中心(质心实际上不存在的)
- 当满足一定条件,如类别划分不在发生变化时,算法终止,否则继续2-3
[外链图片转存失败,源站可能有防盗链机制,建议将图片保存下来直接上传(img-IVq95gX4-1593870599134)(https://i.imgur.com/6Zdir1p.png)]
[外链图片转存失败,源站可能有防盗链机制,建议将图片保存下来直接上传(img-1OzcYvPb-1593870599137)(https://i.imgur.com/3XPw8g7.png)]
[外链图片转存失败,源站可能有防盗链机制,建议将图片保存下来直接上传(img-J0H5ByAr-1593870599144)(https://i.imgur.com/AhLBZqA.png)]
使用场景
- 样本球形分布
- 密度,大小不同的聚类
时间复杂度:
该算法的时间复杂度为:O(nkt)
- n->聚类对象数
- t->迭代次数
- k->初始中心个数
平面划分
两点之间的垂直平分线,迭代划分。
[外链图片转存失败,源站可能有防盗链机制,建议将图片保存下来直接上传(img-MNRYFFZ4-1593870599147)(https://i.imgur.com/tQVzJJQ.png)]
[外链图片转存失败,源站可能有防盗链机制,建议将图片保存下来直接上传(img-PLra3fqQ-1593870599150)(https://i.imgur.com/v8dbhoe.png)]
欧式距离
对于欧式空间的样本数据,以平方误差和(sum of the squared error, SSE)作为聚类的目标函数,同时也可以衡量不同聚类结果好坏的指标:
[外链图片转存失败,源站可能有防盗链机制,建议将图片保存下来直接上传(img-O1ngmHhS-1593870599152)(https://i.imgur.com/mXaB1Ic.png)]
表示样本点x到cluster Ci 的质心 ci 距离平方和;最优的聚类结果应使得SSE达到最小值。
//欧式距离,计算两点距离public double EurDistance(Point point, Point center){double detX = point.getX() - center.getX();double detY = point.getY() - center.getY();return Math.sqrt(detX * detX + detY * detY);}
重新计算每个聚类的中心对象
中心对象:均值
/** 调整聚类中心,按照求平衡点的方法获得新的簇心*/public void adjustCenters(){double sumx[] = new double[k];double sumy[] = new double[k];int count[] = new int[k];// 保存每个簇的横纵坐标之和for (int i = 0; i < k; i++){sumx[i] = 0.0;sumy[i] = 0.0;count[i] = 0;}// 计算每个簇的横纵坐标总和、记录每个簇的个数for (Point point : points){int clusterID = point.getClusterID();// System.out.println(clusterID);sumx[clusterID - 1] += point.getX();sumy[clusterID - 1] += point.getY();count[clusterID - 1]++;}// 更新簇心坐标for (int i = 0; i < k; i++){Point tmpPoint = centers.get(i);tmpPoint.setX(sumx[i] / count[i]);tmpPoint.setY(sumy[i] / count[i]);tmpPoint.setClusterID(i + 1);centers.set(i, tmpPoint);}}终止条件
最小化蔟内对象到质心的距离,从而最小化WCSS。通过损失函数来衡量算法停止条件。
- 损失函数:WCSS
[外链图片转存失败,源站可能有防盗链机制,建议将图片保存下来直接上传(img-qrs2Mhwy-1593870599156)(https://i.imgur.com/xDt54Q7.png)]
xi代表某个样本点,ck代表每个类的中心点。每个类里的元素越凝聚越好。
中心点选择
- K(类别)的选择 细粒度 越多越准确
- 随机选取
- 多次随机:选择最小的WCSS那次聚类
算法优点
- 时间复杂度低,速度快。
- 由具有出色的速度和良好的可扩展性
- 当簇接近高斯分布时,它的效果较好
算法缺点
- 在簇的平均值可被定义的情况下才能使用,可能不适用于某些应用;
- 在 K-means 算法中 K 是事先给定的,这个 K 值的选定是非常难以估计的。很多时候,事先并不知道给定的数据集应该分成多少个类别才最合适;
- 在 K-means 算法中,首先需要根据初始聚类中心来确定一个初始划分,然后对初始划分进行优化。这个初始聚类中心的选择对聚类结果有较大的影响,一旦初始值选择的不好,可能无法得到有效的聚类结果;
- 该算法需要不断地进行样本分类调整,不断地计算调整后的新的聚类中心,因此当数据量非常大时,算法的时间开销是非常大的;
- 若簇中含有异常点,将导致均值偏离严重(即:对噪声和孤立点数据敏感);
- 不适用于发现非凸形状的簇或者大小差别很大的簇。
你可别说为啥这算法缺点比有点还多。“存在即合理!”
Java实现
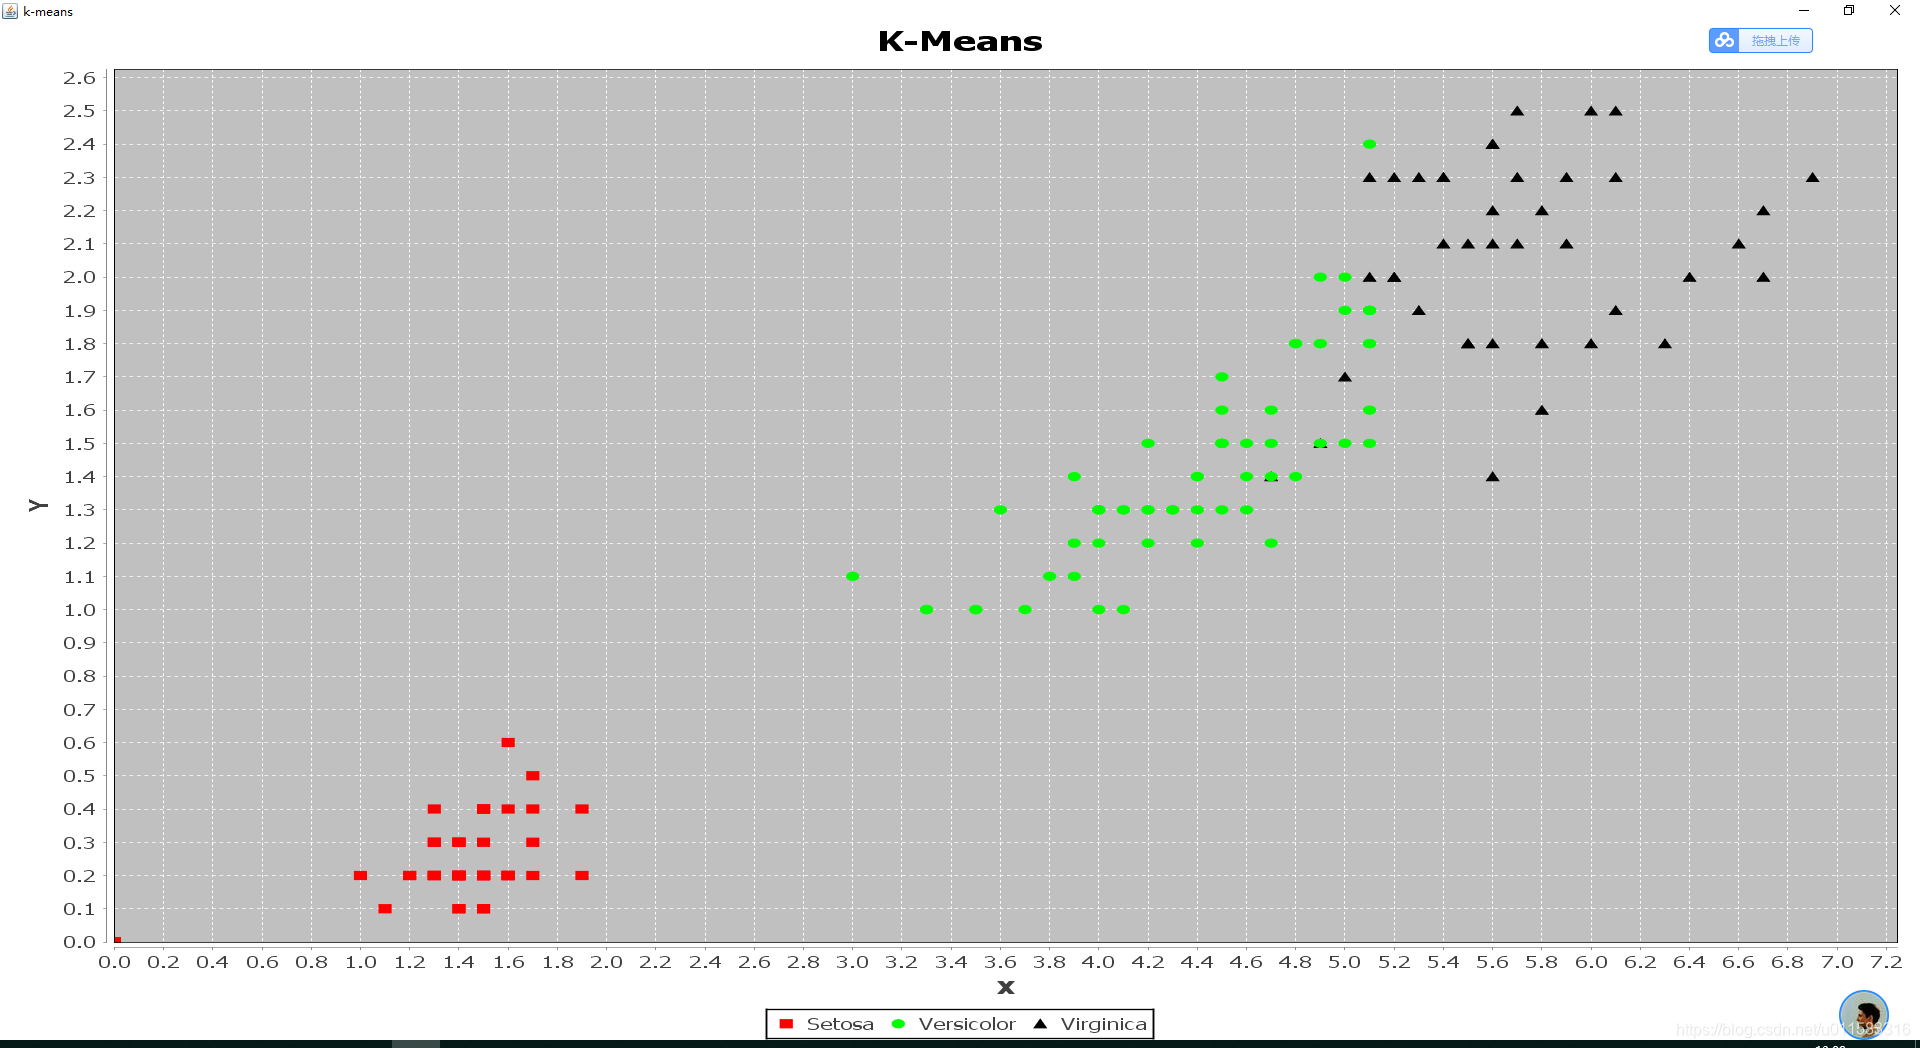
这里结果可视化我用了JfreeChart图表绘制类库。数据集是iris数据集。另外提醒一下就是使用本代码时记得创建文件输出路径,以及导入绘图的核心包。
package com.xianglei.kmeansback;public class Point
{// 点的坐标private Double x;private Double y;private Double z;public int getTag() {return tag;}public void setTag(int tag) {this.tag = tag;}private Double w;// 所在类IDprivate int clusterID = -1;private int tag=0;public Point(Double x, Double y,Double w, Double z) {this.x = x;this.y = y;this.w = w;this.z = z;}public Double getX(){return x;}public void setX(Double x){this.x = x;}public Double getY(){return y;}public Double getZ() {return z;}@Overridepublic String toString() {return "Point [x=" + x + ", y=" + y + ", z=" + z + ", w=" + w + ", clusterID=" + clusterID + "]";}public void setZ(Double z) {this.z = z;}public Double getW() {return w;}public void setW(Double w) {this.w = w;}public void setY(Double y){this.y = y;}public int getClusterID(){return clusterID;}public void setClusterID(int clusterID){this.clusterID = clusterID;}
}
package com.xianglei.kmeansback;import java.util.ArrayList;
import java.util.List;public class KMeansCluster
{// 聚类中心数public int k = 5;// 迭代最大次数public int maxIter = 50;// 测试点集public List<Point> points;// 中心点public List<Point> centers;public static final double MINDISTANCE = 10000.00;public KMeansCluster(int k, int maxIter, List<Point> points) {this.k = k;this.maxIter = maxIter;this.points = points;//初始化中心点initCenters();}/** 初始化聚类中心* 这里的选取策略是,从点集中按序列抽取K个作为初始聚类中心*/public void initCenters(){centers = new ArrayList<>(k);for (int i = 0; i < k; i++){Point tmPoint = points.get(i*33+48);Point center = new Point(tmPoint.getX(), tmPoint.getY(),tmPoint.getW(), tmPoint.getZ());center.setClusterID(i + 1);centers.add(center);}}/** 停止条件是满足迭代次数*/public void runKmeans(){// 已迭代次数int count = 1;while (count++ <= maxIter){// 遍历每个点,确定其所属簇for (Point point : points){if(point.getTag()==0)assignPointToCluster(point);}//调整中心点adjustCenters();}}/** 调整聚类中心,按照求平衡点的方法获得新的簇心*/public void adjustCenters(){double sumx[] = new double[k];double sumy[] = new double[k];double sumw[] = new double[k];double sumz[] = new double[k];int count[] = new int[k];// 保存每个簇的横纵坐标之和 K=3for (int i = 0; i < k; i++){sumx[i] = 0.0;sumy[i] = 0.0;sumw[i] = 0.0;sumz[i] = 0.0;count[i] = 0;}// 计算每个簇的横纵坐标总和、记录每个簇的个数for (Point point : points){if(point.getTag()==0){int clusterID = point.getClusterID();// System.out.println(clusterID);sumx[clusterID - 1] += point.getX();sumy[clusterID - 1] += point.getY();sumw[clusterID - 1] += point.getW();sumz[clusterID - 1] += point.getZ();count[clusterID - 1]++;}}// 更新簇心坐标for (int i = 0; i < k; i++){Point tmpPoint = centers.get(i);tmpPoint.setX(sumx[i] / count[i]);tmpPoint.setY(sumy[i] / count[i]);tmpPoint.setW(sumw[i] / count[i]);tmpPoint.setZ(sumz[i] / count[i]);tmpPoint.setClusterID(i + 1);centers.set(i, tmpPoint);}}/*划分点到某个簇中,欧式距离标准* 对传入的每个点,找到与其最近的簇中心点,将此点加入到簇*/public void assignPointToCluster(Point point){double minDistance = MINDISTANCE;int clusterID = -1;for (Point center : centers){double dis = EurDistance(point, center);if (dis < minDistance){minDistance = dis;clusterID = center.getClusterID();}}point.setClusterID(clusterID);}//欧式距离,计算两点距离public double EurDistance(Point point, Point center){double detX = point.getX() - center.getX();double detY = point.getY() - center.getY();double detW = point.getW() - center.getW();double detZ = point.getZ() - center.getZ();return Math.sqrt(detX * detX + detY * detY+ detW * detW+ detZ * detZ);}
}package com.xianglei.kmeansback;import java.awt.BasicStroke;
import java.awt.Color;
import java.awt.Font;
import java.awt.Image;
import java.awt.image.ImageObserver;
import java.awt.image.ImageProducer;
import java.io.File;
import java.io.FileWriter;
import java.io.IOException;
import java.text.DecimalFormat;
import java.util.ArrayList;
import java.util.HashMap;
import java.util.LinkedList;
import java.util.List;
import java.util.Map;
import java.util.Scanner;import org.jfree.chart.ChartFactory;
import org.jfree.chart.ChartFrame;
import org.jfree.chart.JFreeChart;
import org.jfree.chart.StandardChartTheme;
import org.jfree.chart.annotations.XYTextAnnotation;
import org.jfree.chart.axis.NumberAxis;
import org.jfree.chart.axis.ValueAxis;
import org.jfree.chart.plot.CategoryPlot;
import org.jfree.chart.plot.Plot;
import org.jfree.chart.plot.PlotOrientation;
import org.jfree.chart.plot.XYPlot;
import org.jfree.chart.renderer.xy.XYLineAndShapeRenderer;
import org.jfree.data.xy.DefaultXYDataset;
import org.jfree.data.xy.XYDataset;
import org.jfree.ui.RefineryUtilities;public class Kmean {// 用来聚类的点集public List<Point> points;// 将聚类结果保存到文件FileWriter out = null;// 格式化double类型的输出,保留两位小数DecimalFormat dFormat = new DecimalFormat("00.00");// 具体执行聚类的对象public KMeansCluster kMeansCluster;// 簇的数量,迭代次数public int numCluster = 0;public int numIterator = 200;// 点集的数量,生成指定数量的点集public int numPoints = 50;// 聚类结果保存路径public static final String FILEPATH = "f:/kmeans/res.txt";public static final String DATAPATH = "f:/kmeans/iris.txt";public static void main(String[] args) {// 指定点集个数,簇的个数,迭代次数Kmean kmeans = new Kmean(0, 3, 200000);// 初始化点集、KMeansCluster对象kmeans.init();// 使用KMeansCluster对象进行聚类kmeans.runKmeans();kmeans.printRes();kmeans.Test();kmeans.saveResToFile(FILEPATH);}private void Test() {// TODO Auto-generated method stub}public Kmean(int numPoints, int cluster_number, int iterrator_number) {this.numPoints = numPoints;this.numCluster = cluster_number;this.numIterator = iterrator_number;}private void init() {this.initPoints();kMeansCluster = new KMeansCluster(numCluster, numIterator, points);}private void runKmeans() {kMeansCluster.runKmeans();}// 初始化点集public void initPoints() {points = new ArrayList<>(numPoints);try {Scanner in = new Scanner(new File(DATAPATH));// 读入文件while (in.hasNextLine() && numPoints <= 154) {Point tmpPoint = new Point(null, null, null, null);numPoints++;String str = in.nextLine();// 将文件的每一行存到str的临时变量中String[] split = str.split(" ");tmpPoint.setX(Double.valueOf(split[1]));tmpPoint.setY(Double.valueOf(split[2]));tmpPoint.setZ(Double.valueOf(split[3]));tmpPoint.setW(Double.valueOf(split[4]));if (split[5].contains("setosa"))tmpPoint.setClusterID(1);if (split[5].contains("versicolor"))tmpPoint.setClusterID(2);if (split[5].contains("virginica"))tmpPoint.setClusterID(3);points.add(tmpPoint);System.out.println(numPoints);System.out.println(split[1] + "-" + split[2] + "-" + split[3] + "-" + split[4] + "-" + split[5]+ " - - - 类别:" + tmpPoint.getClusterID());}} catch (Exception e) {}}public void printRes() {System.out.println("==================Centers-I====================");for (Point center : kMeansCluster.centers) {System.out.println(center.toString());}System.out.println("==================Points====================");for (Point point : points) {if (point.getTag() == 0)System.out.println(point.toString());}}public void saveResToFile(String filePath) {try {out = new FileWriter(new File(filePath));String[] stinga = new String[numPoints];String[] stingb = new String[numPoints];String[] tag = new String[numPoints];int i = 0;for (Point point : points) {if (point.getTag() == 0) {out.write(String.valueOf(point.getClusterID()));out.write("-");out.write(dFormat.format(point.getX()));out.write("-");out.write(dFormat.format(point.getY()));out.write(dFormat.format(point.getW()));out.write("-");out.write(dFormat.format(point.getZ()));out.write("\r\n");stinga[i] = Double.toString(point.getZ());stingb[i] = Double.toString(point.getW());tag[i] = Double.toString(point.getClusterID());i++;System.out.println("=================================");System.out.println("聚类后结果:" + point.toString());}}data("k-means", stinga, stingb, tag);out.flush();out.close();} catch (IOException e) {e.printStackTrace();}}public static void data(String title, String[] a, String[] b, String[] t) {DefaultXYDataset xydataset = new DefaultXYDataset();double[][] data = new double[2][a.length];double[][] data2 = new double[2][a.length];double[][] data3 = new double[2][a.length];for (int i = 0; i < a.length; i++) {if (t[i].contains("1")) {data[0][i] = Double.parseDouble(a[i]);data[1][i] = Double.parseDouble(b[i]);}if (t[i].contains("2")) {data2[0][i] = Double.parseDouble(a[i]);data2[1][i] = Double.parseDouble(b[i]);}if (t[i].contains("3")) {data3[0][i] = Double.parseDouble(a[i]);data3[1][i] = Double.parseDouble(b[i]);}}xydataset.addSeries("Setosa", data);xydataset.addSeries("Versicolor", data2);xydataset.addSeries("Virginica", data3);final JFreeChart chart = ChartFactory.createScatterPlot("K-Means", "X", "Y", xydataset,PlotOrientation.VERTICAL, true, true, false);chart.setBorderVisible(false);XYPlot xyPlot2 = chart.getXYPlot();xyPlot2.getRenderer().setSeriesPaint(0, Color.RED);xyPlot2.getRenderer().setSeriesPaint(1, Color.GREEN);xyPlot2.getRenderer().setSeriesPaint(2, Color.black);ChartFrame frame = new ChartFrame(title, chart);frame.pack();RefineryUtilities.centerFrameOnScreen(frame);frame.setVisible(true);}}聚类结果
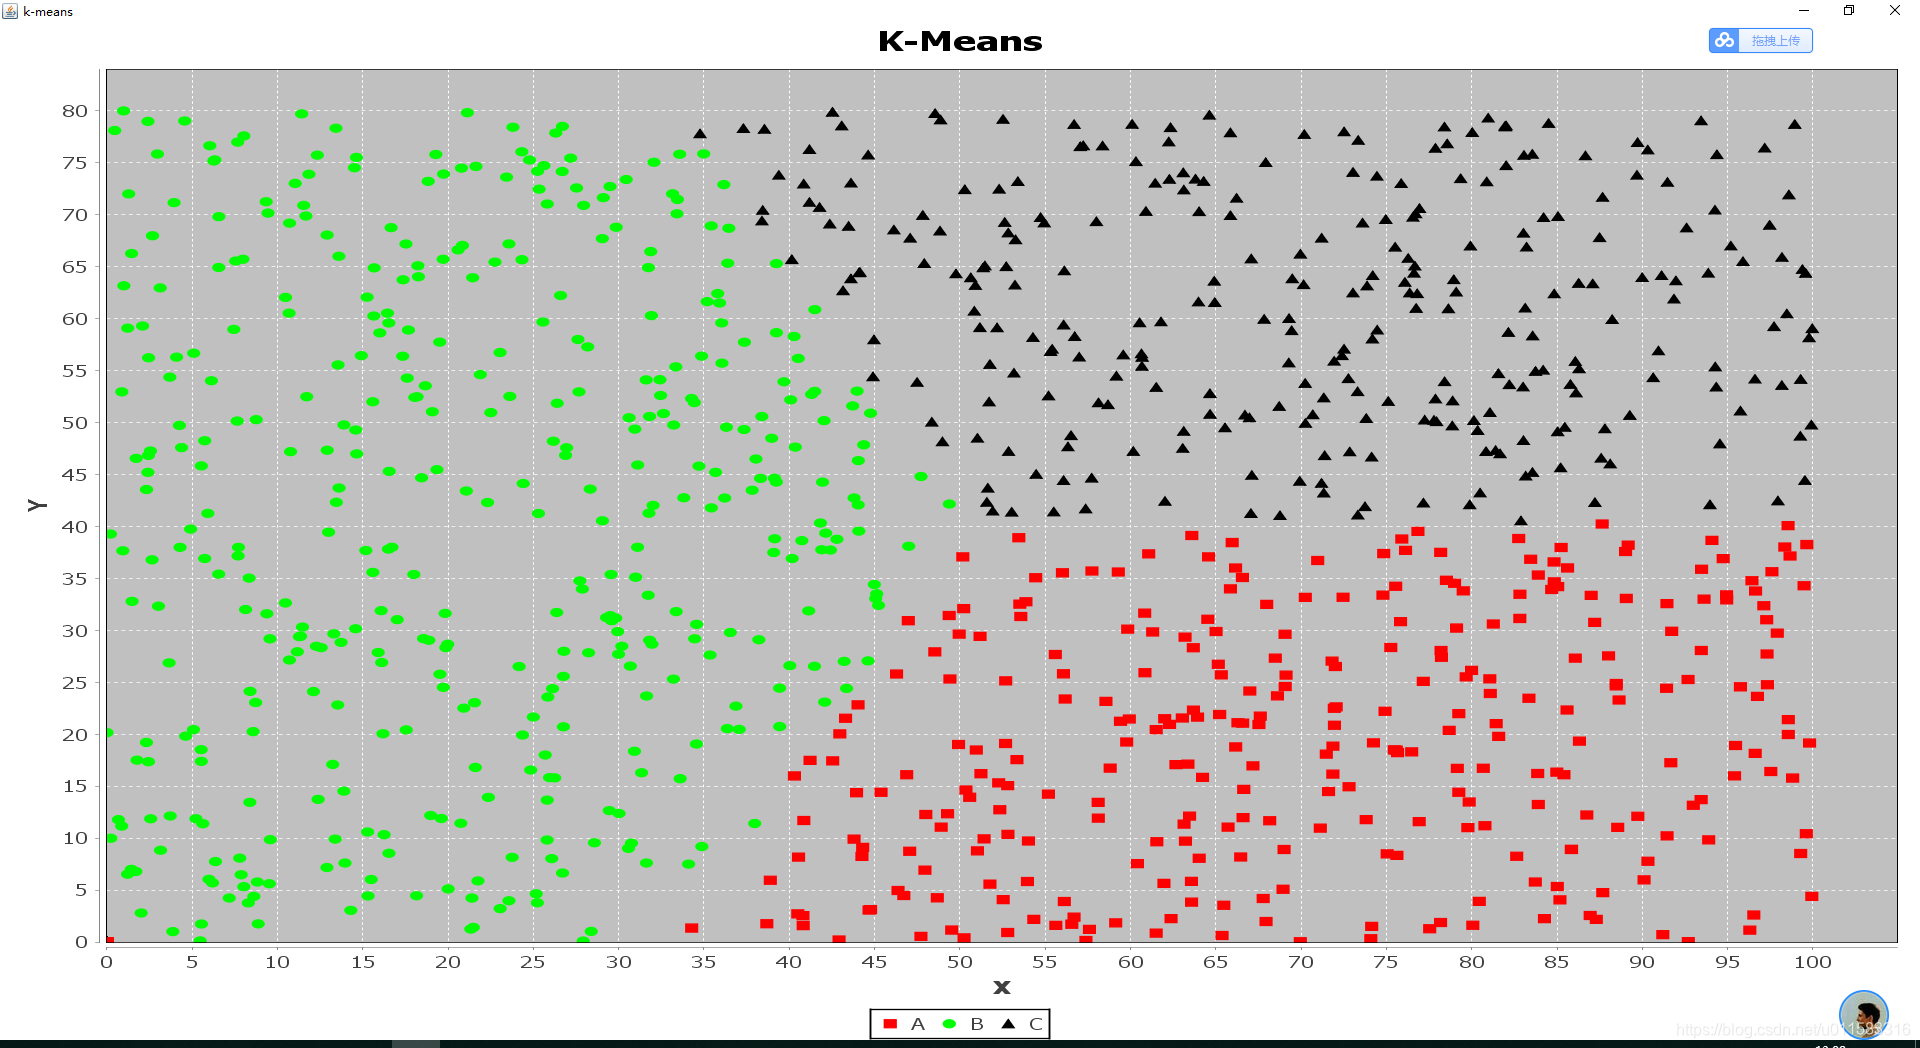
一:随机模拟数据集
二.iris数据集
总结
就算法的思想和实现来讲是比较简单的,也为我的算法学习开了个好头。但是我看了其他大牛的博客后,发现这个算法更多可玩的地方是如何去解决这些缺点。但是由于时间关系,在当下这个时间段我就不深挖了,你要是有兴趣的话给你一个传送门深入理解 K-means算法。???
本文来自互联网用户投稿,文章观点仅代表作者本人,不代表本站立场,不承担相关法律责任。如若转载,请注明出处。 如若内容造成侵权/违法违规/事实不符,请点击【内容举报】进行投诉反馈!