Python数据分析案例三:1880-2010年间全美婴儿姓名数据分析
**一:介绍**
该案例来自《利用Python进行数据分析·第2版》,主要对1880-2010年间全美婴儿姓名进行分析。
二:分析流程
1:读取数据:因为一个年份有一张表,将所有的表信息合成一张以便后续分析。
years = range(1880,2011)
piece = []
columns = ['name','sex', 'births']
将每年的文件转为DataFrame
for year in years:path = 'C:/Users/17322/Desktop/datasets/babynames/yob%d.txt' %yearframe = pd.read_csv(path, names=columns)frame['year']= yearpiece.append(frame)
合成一张
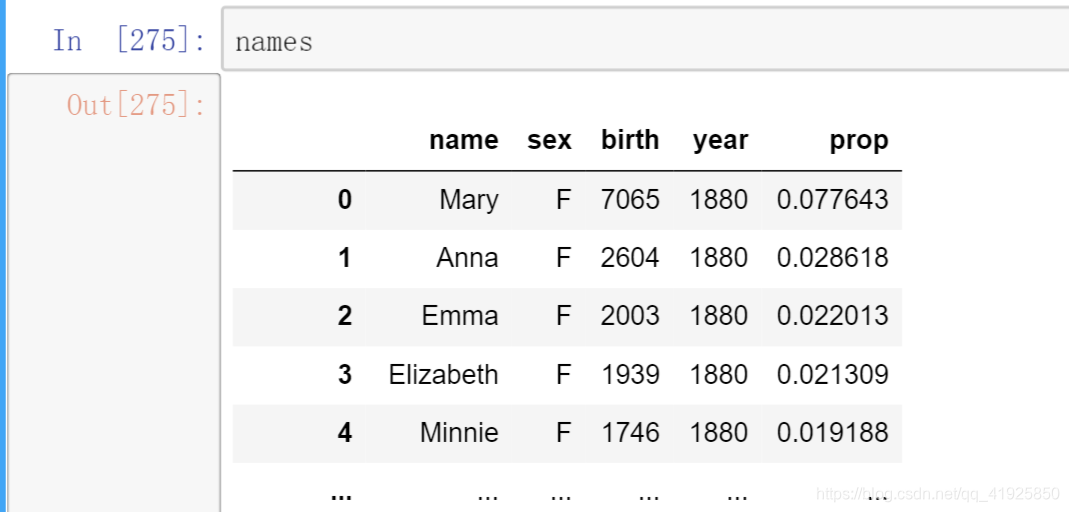
names = pd.concat(piece, ignore_index=True)
2:利用映射表进行聚合作图
total_births = names.pivot_table('birth',index = 'year', columns = 'sex',aggfunc='sum')
total_births.plot(title = 'Total births per year')

3:分析放指定名字的婴儿数相对于总出生数的比例
- 添加proportion列
def add_prop(group):group['prop'] = group.birth / group.birth.sum()return group
names = names.groupby(['year','sex']).apply(add_prop)
4:取子集:取出每个group前n列
def get_n(group,n):return group.sort_values(by = 'birth',ascending=False)[:n]
将数据按([‘year’,‘sex’])重组,取前500/1000个
groups = names.groupby(['year','sex'])
top_500 = groups.apply(get_n,500)
top_500.reset_index(inplace=True,drop=True)
top1000 = groups.apply(get_n,1000)
top1000.reset_index(inplace=True,drop=True)
top1000
另一种方法:
piece=[]
for year,group in names.groupby(['year','sex']):piece.append(group.sort_values(by='birth',ascending=False)[:1000])
top_1000=pd.concat(piece,ignore_index=True)
top_1000

5:利用top1000子集分析命名趋势
boys = top1000[top1000.sex == 'M']
girls = top1000[top1000.sex == 'F']
用pivot_table统计不同年份各名字的命名人数
total_births = top1000.pivot_table('birth',index = 'year',columns = 'name', aggfunc='sum')
subset = total_births[['Tom','Emma', 'Mary', 'Anna']]
subset

做表
subset.plot(subplots=True,figsize=(14,12),grid=False,title='number of births per year of chosen names')

6:评估命名的多样性
(1)思路仍是使用pivot_table();
table = top1000.pivot_table('prop',index='year',columns='sex',aggfunc=sum)
table.plot(title = 'the proportion of the sum of names top 1000',yticks=np.linspace(0.5,1。0,10),xticks=range(1880,2020,10),grid=True)
前1000个名字的人数占总婴儿人数的比值

table = top_500.pivot_table('prop',index='year',columns='sex',aggfunc=sum)
table.plot(title = 'the proportion of the sum of names top 500',yticks=np.linspace(0.5,1,10),xticks=range(1880,2020,10),grid=True)
前500个名字的人数占总婴儿人数的比值

(2)第二个反应多样性的方法:计算前多少个名字的人数加起来才够50%
return cumsum()
def get_midian_counts(group):group = group.sort_values(by='prop',ascending=False)return group.prop.cumsum().values.searchsorted(0.5)+1
所有年份对应的midian_counts+[‘year’,‘sex’]组成的Series:
all_midian = top1000.groupby(['year','sex']).apply(get_midian_counts)
转为DataFrame
Diversity_names = all_midian.unstack('sex')
作图
Diversity_names.plot(title = 'diversity of names in top 50%')

7:名字最后一个字母的比例变化
get_last_letter= lambda x:x[-1]
last_letters = names.name.map(get_last_letter)
last_letters.name = 'last_letter'
last_letters

取三个年份的名字最后字母聚合表
table = names.pivot_table('birth',index=last_letters,columns=['sex','year'],aggfunc=sum)
subtable = table.reindex(columns=[1880,1930,2010],level='year')

计算出不同字母人数所占比例
letter_prop = subtable/subtable.sum()
letter_prop

可视化:
import matplotlib.pyplot as plt
fig,axes = plt.subplots(2,1,figsize=(12,12))
letter_prop['M'].plot(kind='bar',rot=0,ax=axes[0],title='Male')
letter_prop['F'].plot(kind='bar',rot=0,ax=axes[1],title='Female',legend=False)

也可选取特定字母观察变化趋势:
letter_prop = table/table.sum()
T = letter_prop.loc[['d','m','h'],'F'].T
T.head()


8:观察‘lesl’在男女名字中的情况
all_names = pd.Series(top1000.name.unique())
girl_likes = all_names[all_names.str.lower().str.contains('lesl')]

将所有名字包含‘lesl’字段的列筛选出来
filtered = top1000[top1000.name.isin(girl_likes)]
重组
table = filtered.pivot_table('birth',index='year',columns='sex',aggfunc=sum)
将值换为相对比例
table = table.div(table.sum(1), axis=0)
可视化:
table.plot(style = {'M':'k-','F':'k--'})

本文来自互联网用户投稿,文章观点仅代表作者本人,不代表本站立场,不承担相关法律责任。如若转载,请注明出处。 如若内容造成侵权/违法违规/事实不符,请点击【内容举报】进行投诉反馈!