Python3绘图库Matplotlib(01)
1 First plots with Matplotlib
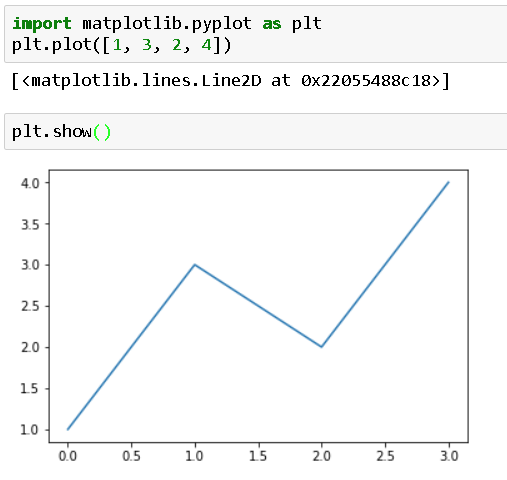
简单的绘图1
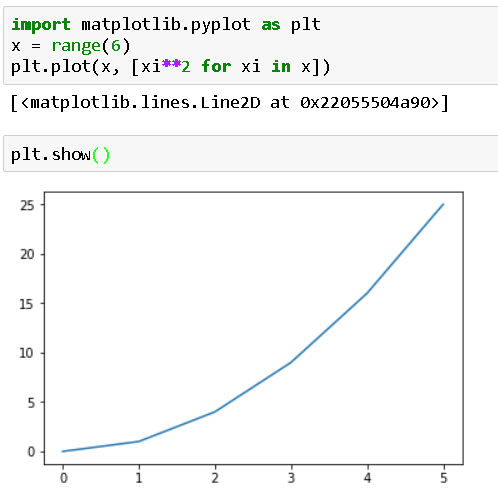
简单的绘图2
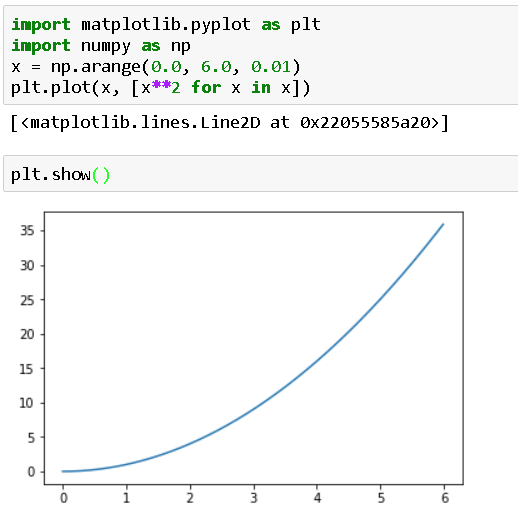
简单的绘图3
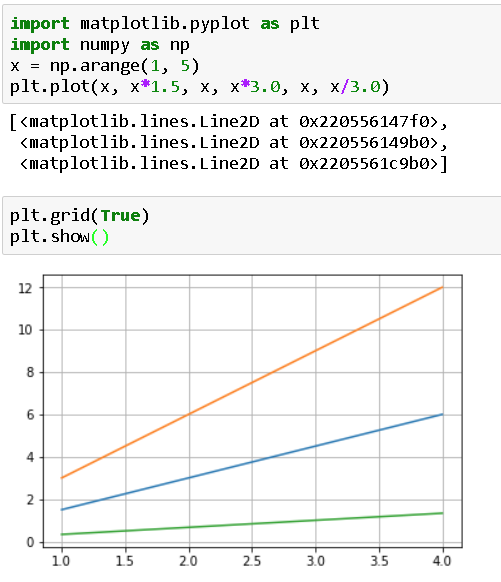
2 网格 = grid
3 设置坐标轴的取值范围 = axis xlim ylim
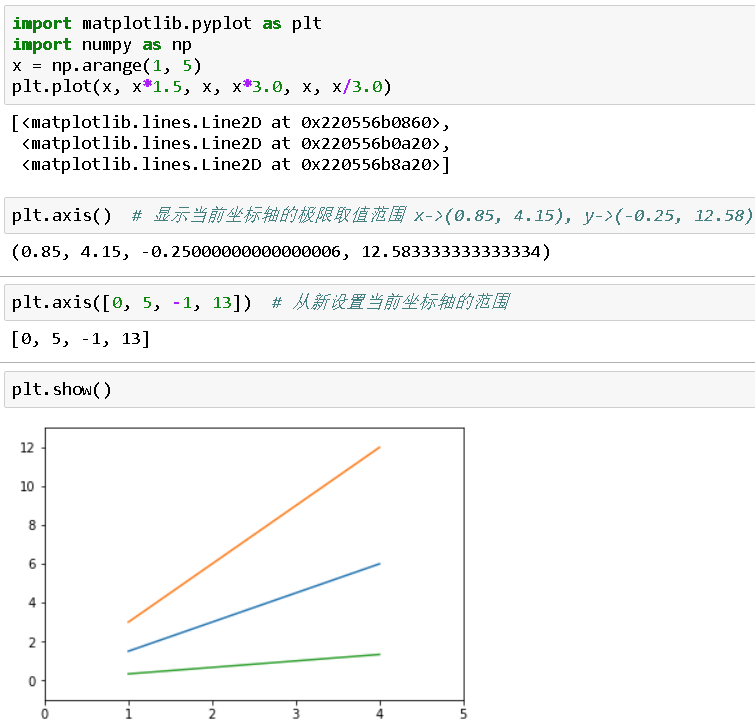
方法1:整体设置
[xmin, xmax, ymin, ymax] ===》plt.axis([xmin, xmax, ymin, ymax])方法2:分别设置
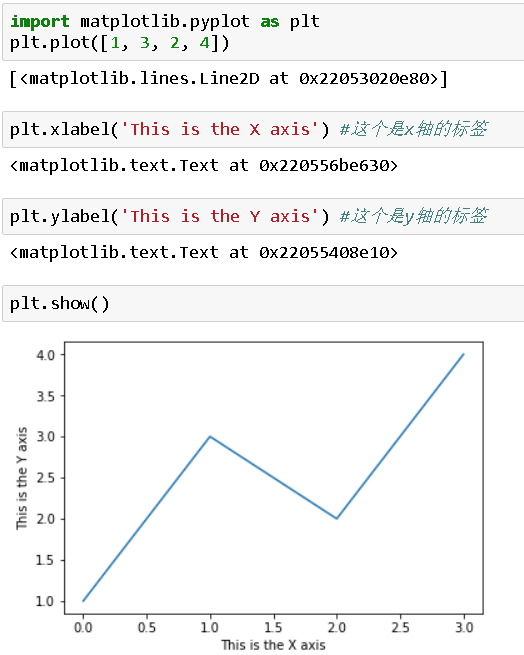
plt.xlim([xmin, xmax]) plt.ylim([ymin, ymax])4 设置坐标含义标签 = label
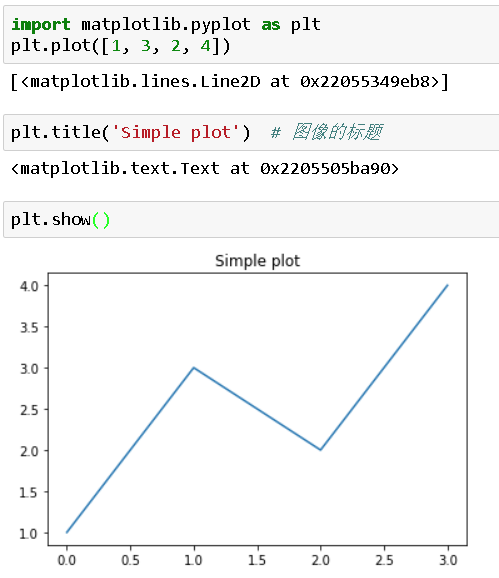
5 设置图片的整体标题 = title
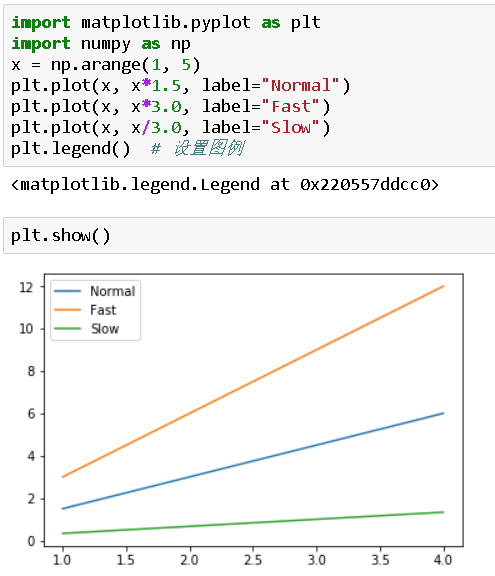
6 设置图例 = legend
方法2:
plt.plot(x, x*1.5) plt.plot(x, x*3.0) plt.plot(x, x/3.0) plt.legend(['Normal', 'Fast', 'Slow'])图例的位置参数:loc = Code
| String | Code |
| best | 0 |
| upper right | 1 |
| upper left | 2 |
| lower left | 3 |
| lower right | 4 |
| right | 5 |
| center left | 6 |
| center right | 7 |
| lower center | 8 |
| upper center | 9 |
| center | 10 |
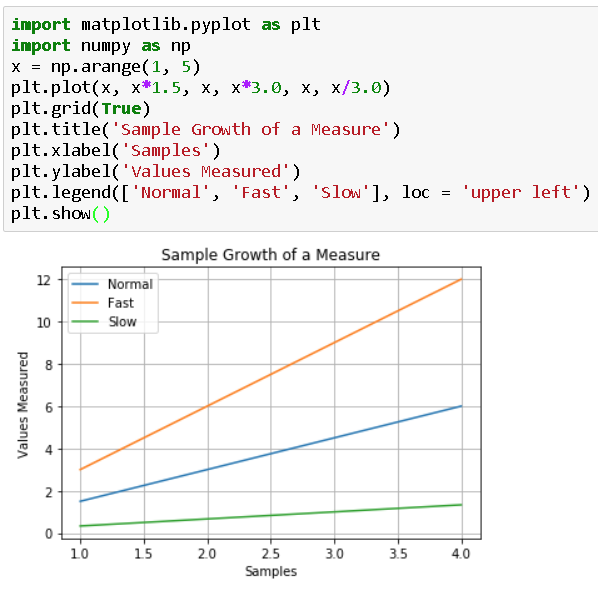
7 一副完整的图像
8 保存图片 = savefig
import matplotlib.pyplot as plt
plt.plot([1, 2, 3])
plt.savefig("plot123.png")
plt.savefig('plot123_2.png', dpi=200)
#
import matplotlib as mpl
mpl.rcParams['figure.figsize']
mpl.rcParams['savefig.dpi']
mpl.reParams['Agg']
9 本小结所有代码示例
import matplotlib.pyplot as plt
plt.plot([1, 3, 2, 4])
plt.show()import matplotlib.pyplot as plt
x = range(6)
plt.plot(x, [xi**2 for xi in x])
plt.show()import matplotlib.pyplot as plt
import numpy as np
x = np.arange(0.0, 6.0, 0.01)
plt.plot(x, [x**2 for x in x])
plt.show()import matplotlib.pyplot as plt
import numpy as np
x = np.arange(1, 5)
plt.plot(x, x*1.5, x, x*3.0, x, x/3.0)
plt.grid(True)
plt.show()import matplotlib.pyplot as plt
import numpy as np
x = np.arange(1, 5)
plt.plot(x, x*1.5, x, x*3.0, x, x/3.0)
plt.axis() # 显示当前坐标轴的极限取值范围 x->(0.85, 4.15), y->(-0.25, 12.58)
plt.axis([0, 5, -1, 13]) # 从新设置当前坐标轴的范围
plt.show()import matplotlib.pyplot as plt
plt.plot([1, 3, 2, 4])
plt.xlabel('This is the X axis') #这个是x轴的标签
plt.ylabel('This is the Y axis') #这个是y轴的标签
plt.show()import matplotlib.pyplot as plt
plt.plot([1, 3, 2, 4])
plt.title('Simple plot') # 图像的标题
plt.show()import matplotlib.pyplot as plt
import numpy as np
x = np.arange(1, 5)
plt.plot(x, x*1.5, label="Normal")
plt.plot(x, x*3.0, label="Fast")
plt.plot(x, x/3.0, label="Slow")
plt.legend() # 设置图例
plt.show()import matplotlib.pyplot as plt
import numpy as np
x = np.arange(1, 5)
plt.plot(x, x*1.5, x, x*3.0, x, x/3.0)
plt.grid(True)
plt.title('Sample Growth of a Measure')
plt.xlabel('Samples')
plt.ylabel('Values Measured')
plt.legend(['Normal', 'Fast', 'Slow'], loc = 'upper left')
plt.show()import matplotlib.pyplot as plt
plt.plot([1, 2, 3])
plt.savefig("plot123.png")
import matplotlib as mpl
mpl.rcParams['figure.figsize']
mpl.rcParams['savefig.dpi']
plt.savefig('plot123_2.png', dpi=200)
知识在于点点滴滴的积累,我会在这个路上Go ahead,
有幸看到我博客的朋友们,若能学到知识,请多多关注以及讨论,让我们共同进步,扬帆起航。后记:打油诗一首
适度锻炼,量化指标
考量天气,设定目标
科学锻炼,成就体标
高效科研,实现学标
转载于:https://www.cnblogs.com/brightyuxl/p/9251258.html
本文来自互联网用户投稿,文章观点仅代表作者本人,不代表本站立场,不承担相关法律责任。如若转载,请注明出处。 如若内容造成侵权/违法违规/事实不符,请点击【内容举报】进行投诉反馈!