SpringBoot+Prometheus+Grafana 实现自定义监控
点击关注公众号,实用技术文章及时了解
Spring Boot 工程集成 Micrometer
引入依赖
配置
监控jvm信息
创建自定义监控
添加具体业务代码监控
集成 Prometheus
安装
集成配置
使用 Grafana Dashboard 展示监控项
安装grafana
配置prometheus数据源
增加jvm面板
配置业务接口监控面板
1.Spring Boot 工程集成 Micrometer
1.1引入依赖
org.springframework.boot spring-boot-starter-actuator
io.micrometer micrometer-registry-prometheus
1.2配置
management.server.port=9003
management.endpoints.web.exposure.include=*
management.endpoint.metrics.enabled=true
management.endpoint.health.show-details=always
management.endpoint.health.probes.enabled=true
management.endpoint.prometheus.enabled=true
management.metrics.export.prometheus.enabled=true
management.metrics.tags.application=voice-qc-backend
这里 management.endpoints.web.exposure.include=* 配置为开启 Actuator 服务,因为Spring Boot Actuator 会自动配置一个 URL 为 /actuator/Prometheus 的 HTTP 服务来供 Prometheus 抓取数据,不过默认该服务是关闭的,该配置将打开所有的 Actuator 服务。
management.metrics.tags.application 配置会将该工程应用名称添加到计量器注册表的 tag 中去,方便后边 Prometheus 根据应用名称来区分不同的服务。
1.3监控jvm信息
然后在工程启动主类中添加 Bean 如下来监控 JVM 性能指标信息:
@SpringBootApplication
public class GatewayDatumApplication {public static void main(String[] args) {SpringApplication.run(GatewayDatumApplication.class, args);}@BeanMeterRegistryCustomizer configurer(@Value("${spring.application.name}") String applicationName) {return (registry) -> registry.config().commonTags("application", applicationName);}}
1.4创建自定义监控
监控请求次数与响应时间
package com.lianxin.gobot.api.monitor;import io.micrometer.core.instrument.Counter;
import io.micrometer.core.instrument.MeterRegistry;
import io.micrometer.core.instrument.Timer;
import lombok.Getter;
import org.springframework.beans.factory.annotation.Autowired;
import org.springframework.beans.factory.annotation.Value;
import org.springframework.stereotype.Component;import javax.annotation.PostConstruct;/*** @Author: GZ* @CreateTime: 2022-08-30 10:50* @Description: 自定义监控服务* @Version: 1.0*/
@Component
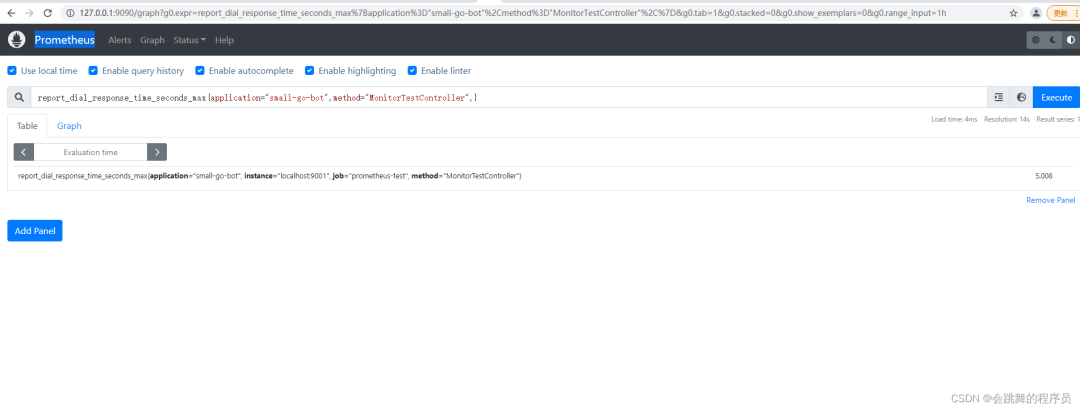
public class PrometheusCustomMonitor {/*** 上报拨打请求次数*/@Getterprivate Counter reportDialRequestCount;/*** 上报拨打URL*/@Value("${lx.call-result-report.url}")private String callReportUrl;/*** 上报拨打响应时间*/@Getterprivate Timer reportDialResponseTime;@Getterprivate final MeterRegistry registry;@Autowiredpublic PrometheusCustomMonitor(MeterRegistry registry) {this.registry = registry;}@PostConstructprivate void init() {reportDialRequestCount = registry.counter("go_api_report_dial_request_count", "url",callReportUrl);reportDialResponseTime= registry.timer("go_api_report_dial_response_time", "url",callReportUrl);}
}1.5添加具体业务代码监控
//统计请求次数
prometheusCustomMonitor.getReportDialRequestCount().increment();
long startTime = System.currentTimeMillis();
String company = HttpUtils.post(companyUrl,"");
//统计响应时间
long endTime = System.currentTimeMillis();
prometheusCustomMonitor.getReportDialResponseTime().record(endTime-startTime, TimeUnit.MILLISECONDS);
在浏览器访问 http://127.0.0.1:9001/actuator/prometheus ,就可以看到服务的一系列不同类型 metrics 信息,例如jvm_memory_used_bytes gauge、jvm_gc_memory_promoted_bytes_total counter ,go_api_report_dial_request_count等
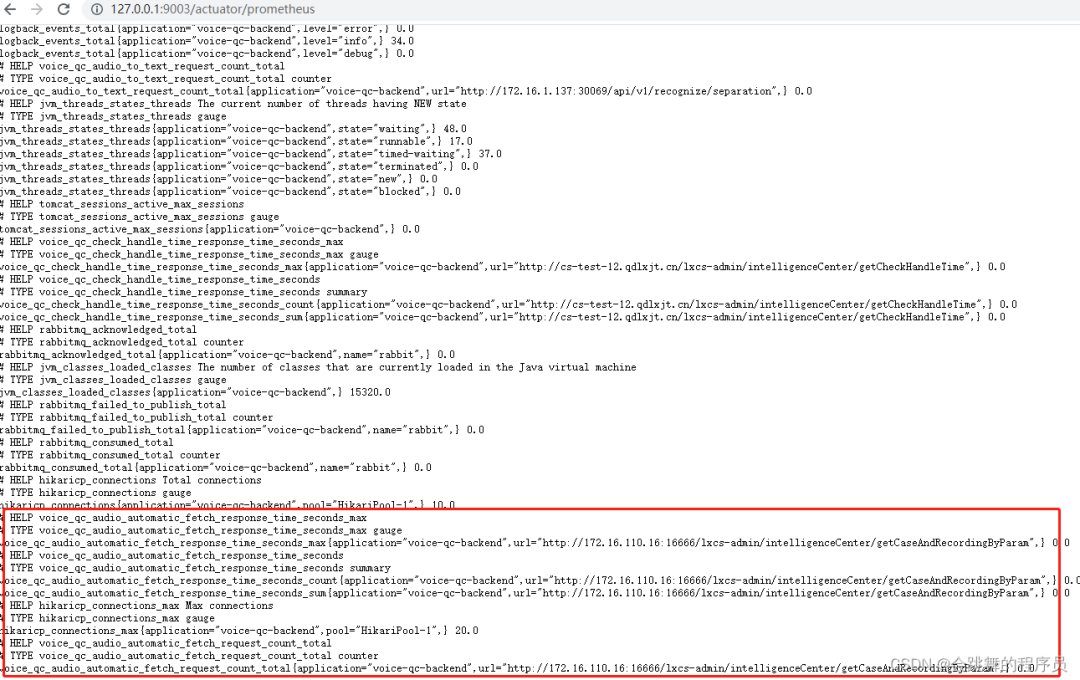
到此,Spring Boot 工程集成 Micrometer 就已经完成,接下里就要与 Prometheus 进行集成了。
2.集成 Prometheus
2.1安装
docker pull prom/prometheusmdkir /usr/local/prometheusvi prometheus.yml# my global config
global:scrape_interval: 15s # Set the scrape interval to every 15 seconds. Default is every 1 minute.evaluation_interval: 15s # Evaluate rules every 15 seconds. The default is every 1 minute.# scrape_timeout is set to the global default (10s).# Alertmanager configuration
alerting:alertmanagers:- static_configs:- targets:# - alertmanager:9093# Load rules once and periodically evaluate them according to the global 'evaluation_interval'.
rule_files:# - "first_rules.yml"# - "second_rules.yml"# A scrape configuration containing exactly one endpoint to scrape:
# Here it's Prometheus itself.
scrape_configs:# The job name is added as a label `job=` to any timeseries scraped from this config.- job_name: 'prometheus'# metrics_path defaults to '/metrics'# scheme defaults to 'http'.static_configs:- targets: ['192.168.136.129:9090'] docker run -d --name prometheus -p 9090:9090 -v/usr/local/prometheus/prometheus.yml:/etc/prometheus/prometheus.yml prom/prometheus
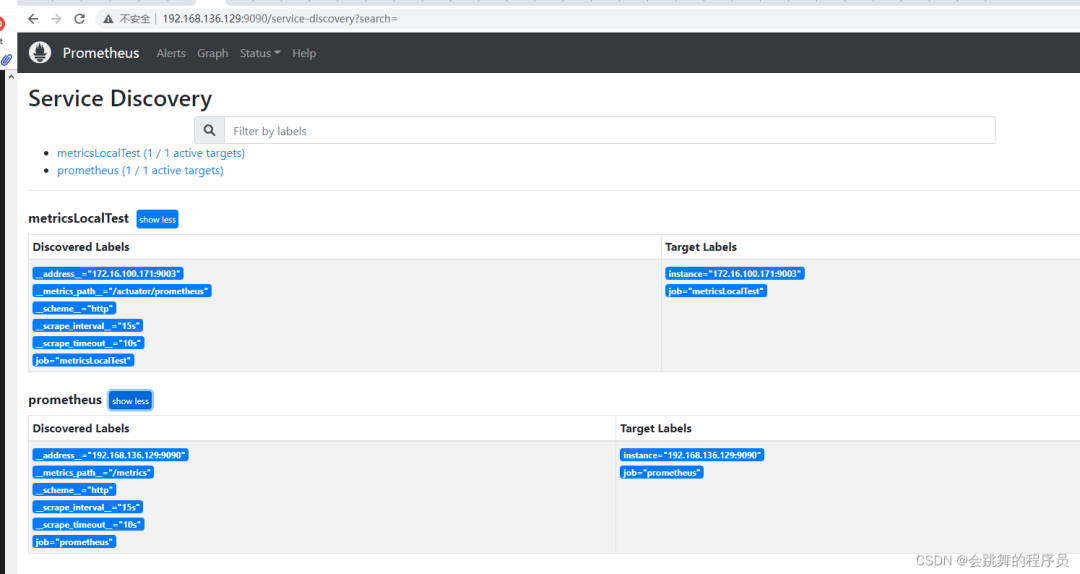
2.2集成配置
global:scrape_interval: 15sscrape_configs:- job_name: "prometheus"static_configs:- targets: ["localhost:9090"]- job_name: "metricsLocalTest"metrics_path: "/actuator/prometheus"static_configs:- targets: ["localhost:9003"]这里 localhost:9001 就是上边本地启动的服务地址,也就是 Prometheus 要监控的服务地址。同时可以添加一些与应用相关的标签,方便后期执行 PromSQL 查询语句区分。最后重启 Prometheus 服务
3.使用 Grafana Dashboard 展示监控项
3.1安装grafana
docker pull grafana/grafanadocker run -d --name grafana -p 3000:3000 -v /usr/local/grafana:/var/lib/grafana grafana/grafana默认用户名/密码 admin/admin
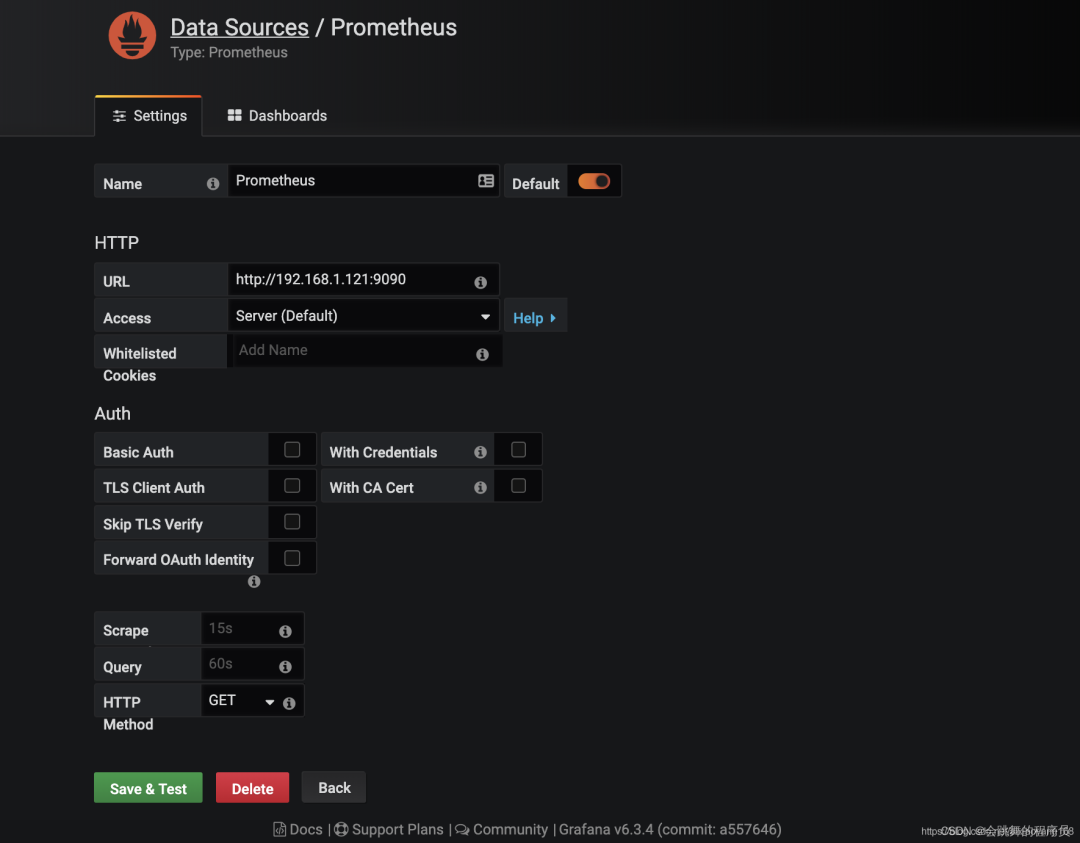
3.2配置prometheus数据源
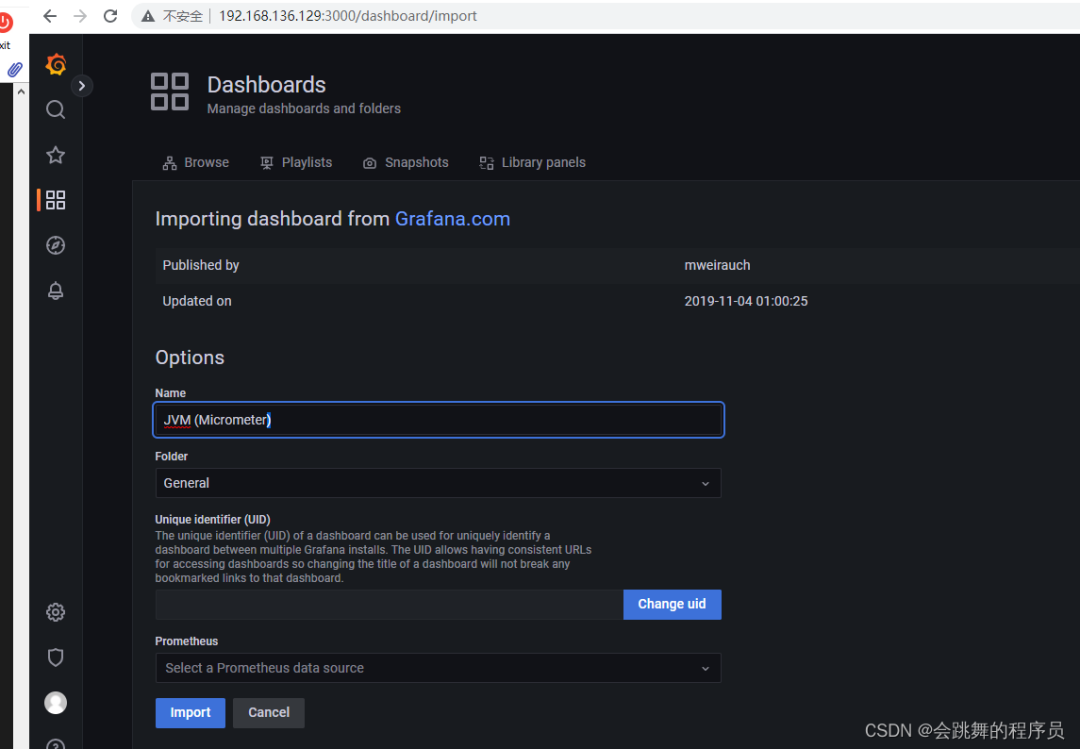
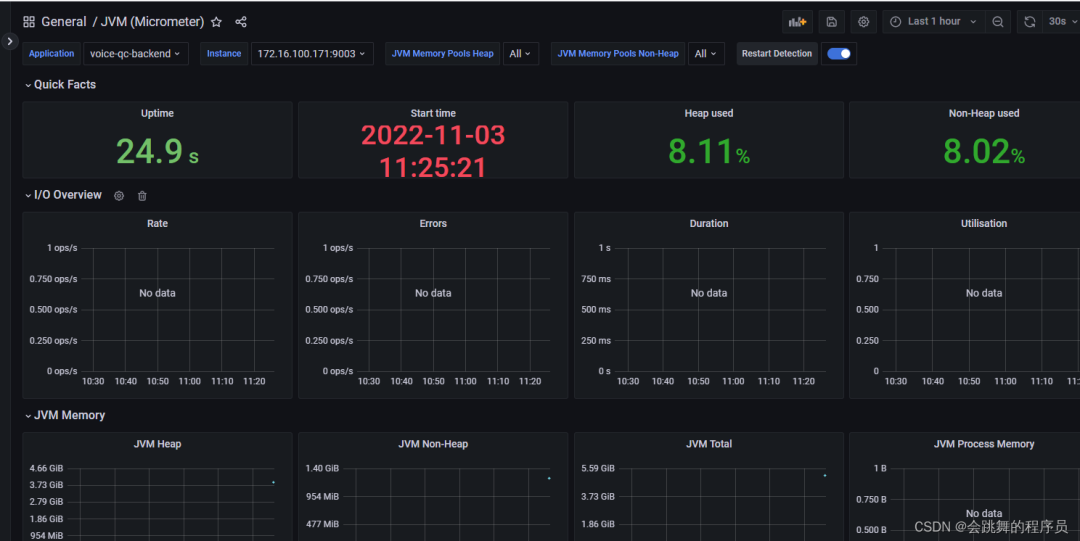
3.3增加jvm面板
模板编号为4701
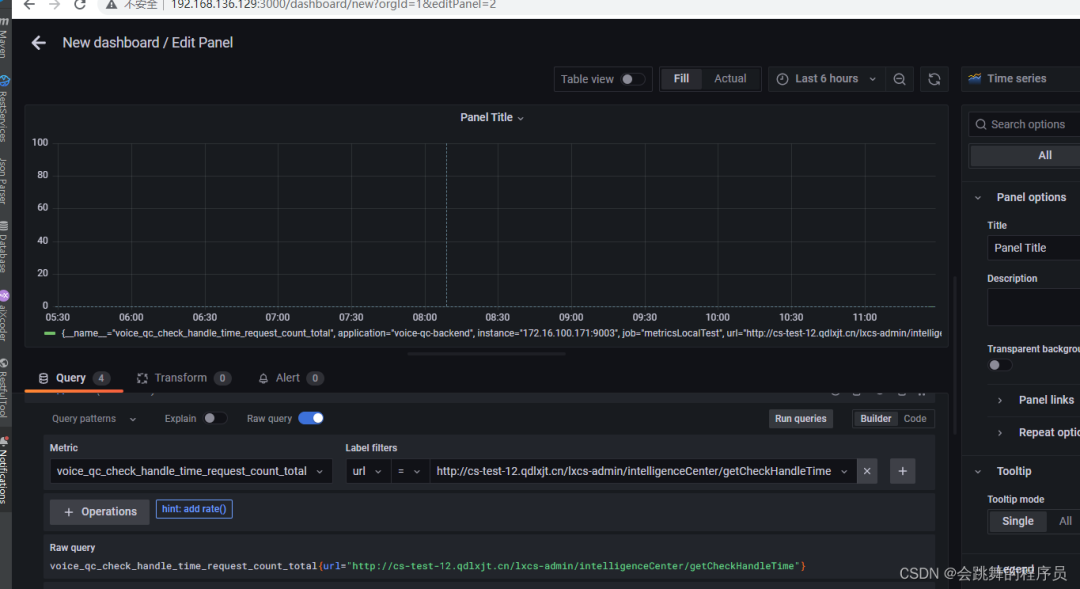
3.4配置业务接口监控面板
感谢阅读,希望对你有所帮助 :)
来源:blog.csdn.net/GZ946/article/details/126619218
推荐
Java面试题宝典
技术内卷群,一起来学习!!PS:因为公众号平台更改了推送规则,如果不想错过内容,记得读完点一下“在看”,加个“星标”,这样每次新文章推送才会第一时间出现在你的订阅列表里。点“在看”支持我们吧!
本文来自互联网用户投稿,文章观点仅代表作者本人,不代表本站立场,不承担相关法律责任。如若转载,请注明出处。 如若内容造成侵权/违法违规/事实不符,请点击【内容举报】进行投诉反馈!