十分钟就能上手Prometheus与Grafana监控SpringBoot项目

🍁 作者:知识浅谈,CSDN签约讲师,CSDN原力作者,后端领域优质创作者,热爱分享创作
💒 公众号:知识浅谈
📌 擅长领域:全栈工程师、爬虫、ACM算法
🔥 联系方式vx:zsqtcc
🤞这次都给他拿下🤞
十分钟快速上手Prometheus与Grafana监控SpringBoot项目
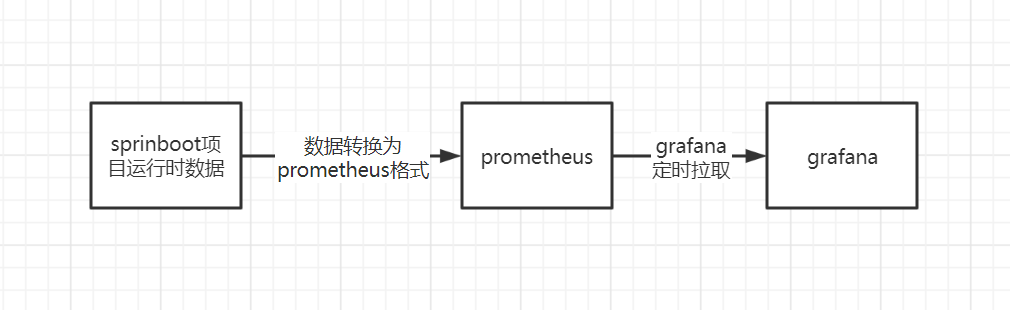
先来捋一下数据流的传输
正菜来了⛳⛳⛳
环境:
springboot项目:127.0.0.1:8081
prometheus:127.0.0.1:9090
grafana:127.0.0.1:3000
🎈项目的创建
📐第 1 步:pom文件依赖
<dependency><groupId>org.springframework.bootgroupId><artifactId>spring-boot-actuatorartifactId>
dependency>

<dependency><groupId>io.micrometergroupId><artifactId>micrometer-registry-prometheusartifactId><version>1.9.2version>
dependency>
📐第 2 步:application配置文件
spring:application:name: springboot-prometheus
#对外暴露哪些指标
management:endpoints:web:exposure:include: "*"#激活promethues并转换为对应的promethues数据endpoint:prometheus:enabled: truehealth:show-details: always#允许对应的数据指标被导出metrics:export:prometheus:enabled: true
server:port: 8081
📐第 3 步:为启动类设置自定义标签
@SpringBootApplication
public class SpringbootdemoApplication {public static void main(String[] args) {SpringApplication.run(SpringbootdemoApplication.class, args);}// 为实例设置自定义标签@BeanMeterRegistryCustomizer<MeterRegistry> configurer(@Value("${spring.application.name}") String name){return registry -> registry.config().commonTags("application",name);}}
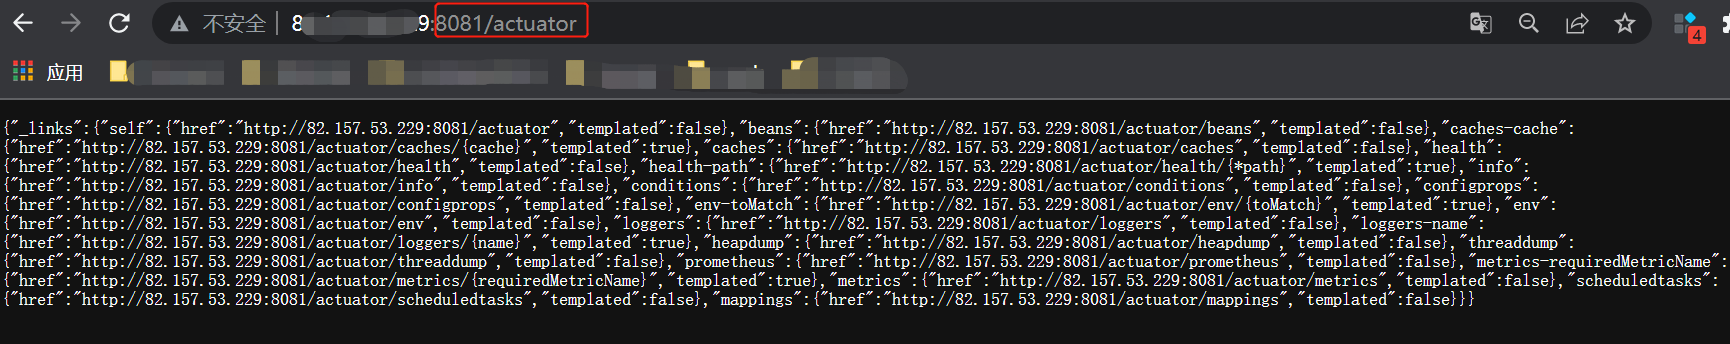
📐第 4 步:启动之后结果
🎈Prometheus搭建
📐第 1 步: 创建prometheus配置文件
- mkdir -p /etc/prometheus
- vi /etc/prometheus/prometheus.yml
#my global config
global:scrape_interval: 15s # Set the scrape interval to every 15 seconds. Default is every 1 minute.evaluation_interval: 15s # Evaluate rules every 15 seconds. The default is every 1 minute.# scrape_timeout is set to the global default (10s).# Alertmanager configuration
alerting:alertmanagers:- static_configs:- targets:# - alertmanager:9093# Load rules once and periodically evaluate them according to the global 'evaluation_interval'.
rule_files:# - "first_rules.yml"# - "second_rules.yml"# A scrape configuration containing exactly one endpoint to scrape:
# Here it's Prometheus itself.
scrape_configs:# The job name is added as a label `job=` to any timeseries scraped from this config. - job_name: 'prometheus'# metrics_path defaults to '/metrics'# scheme defaults to 'http'.static_configs:- targets: ['localhost:9090']
### 以下内容为springboot的配置,主要是这个地方- job_name: 'springboot_promethues'scrape_interval: 5smetrics_path: '/actuator/prometheus'static_configs:- targets: ['localhost:8081']
📐第 2 步 :prometheus docker容器的创建
docker run -d --name=prometheus -v /etc/prometheus/prometheus.yml:/etc/prometheus/prometheus.yml -p 9090:9090 bitnami/prometheus:latest
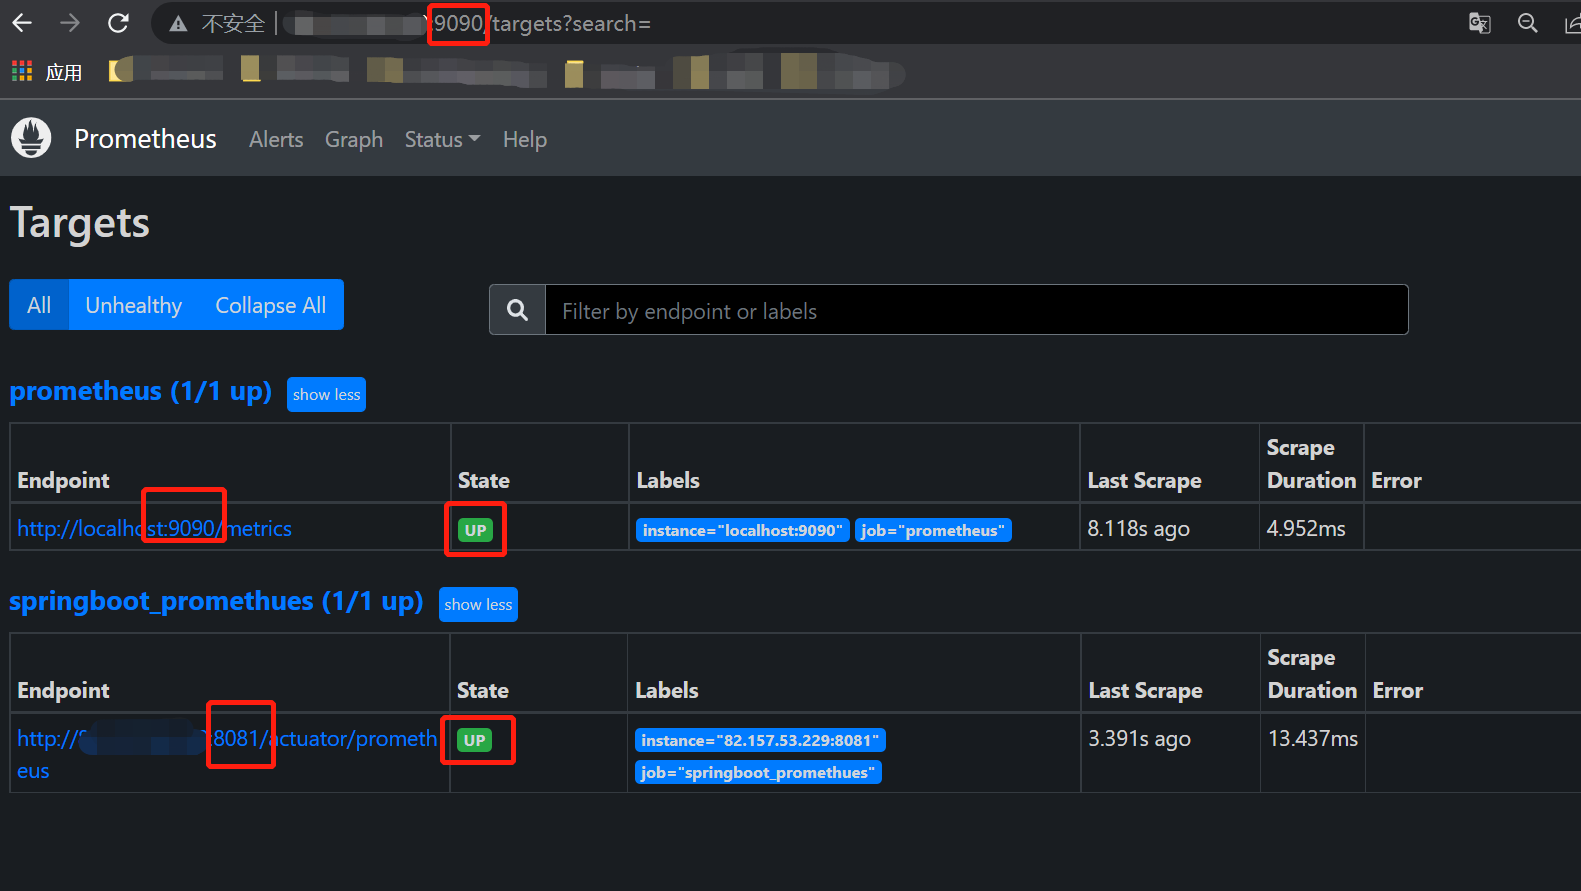
📐第 3 步:查看结果
🎈Grafana搭建
📐第 1 步: 创建grafana容器
docker run -d --name=grafana -p 3000:3000 grafana/grafana
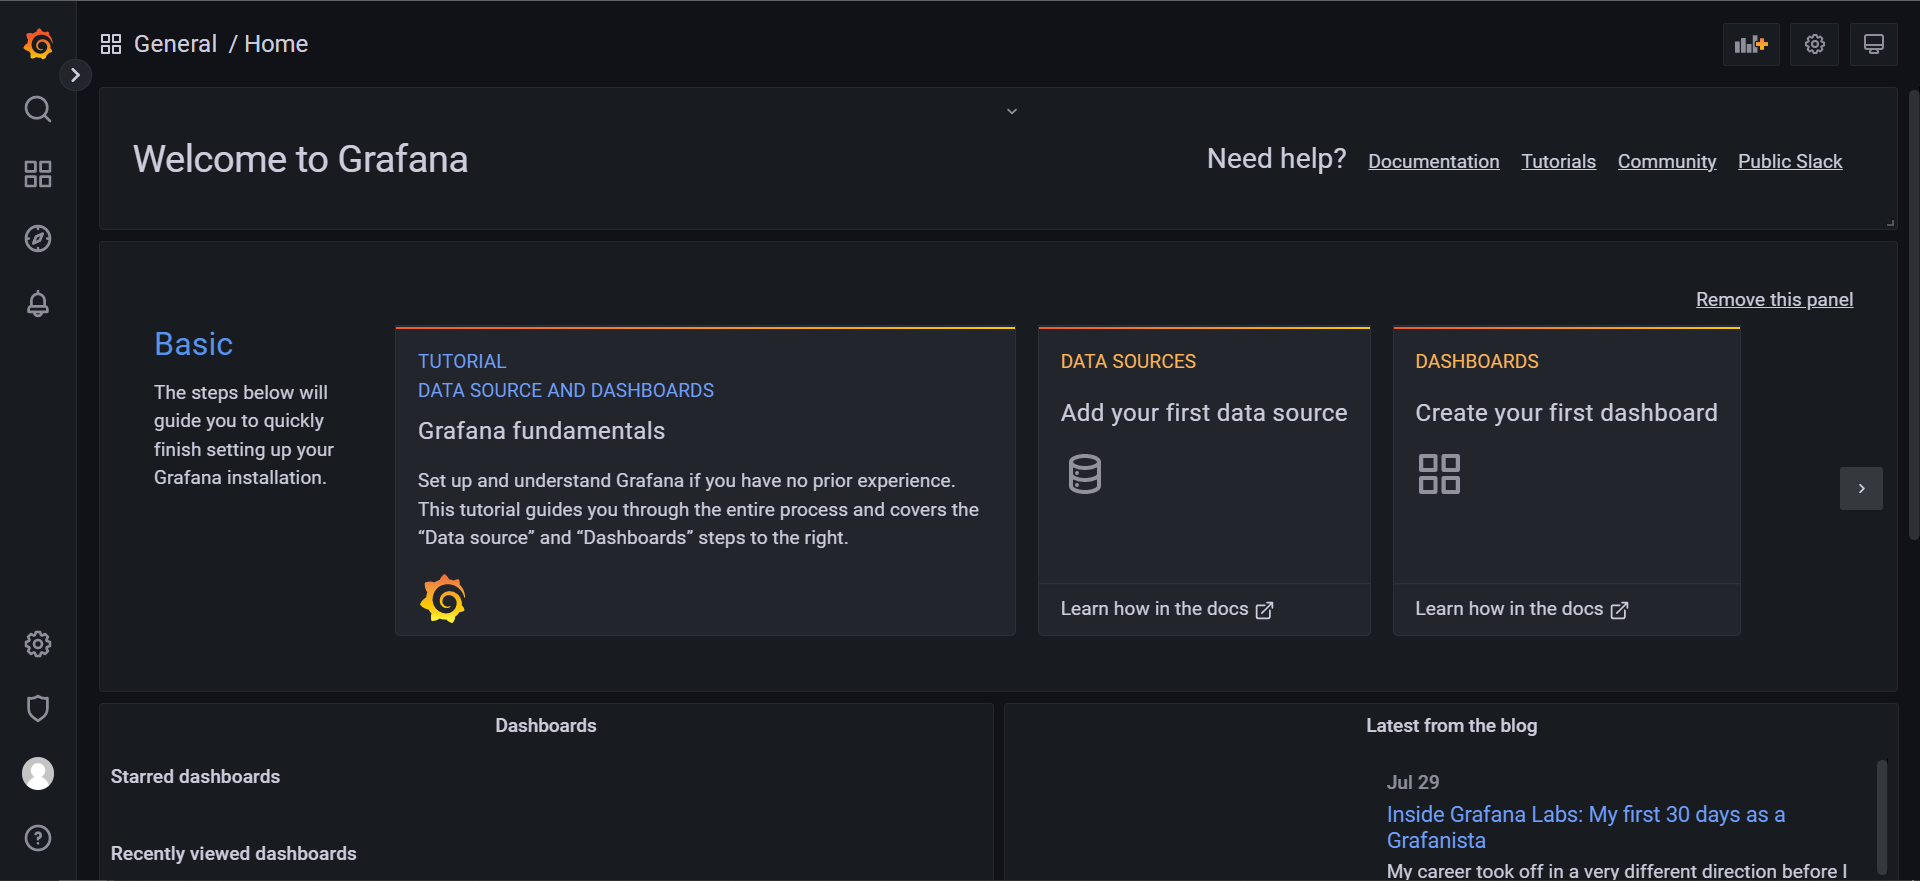
📐第 3 步:登陆账号密码都是admin
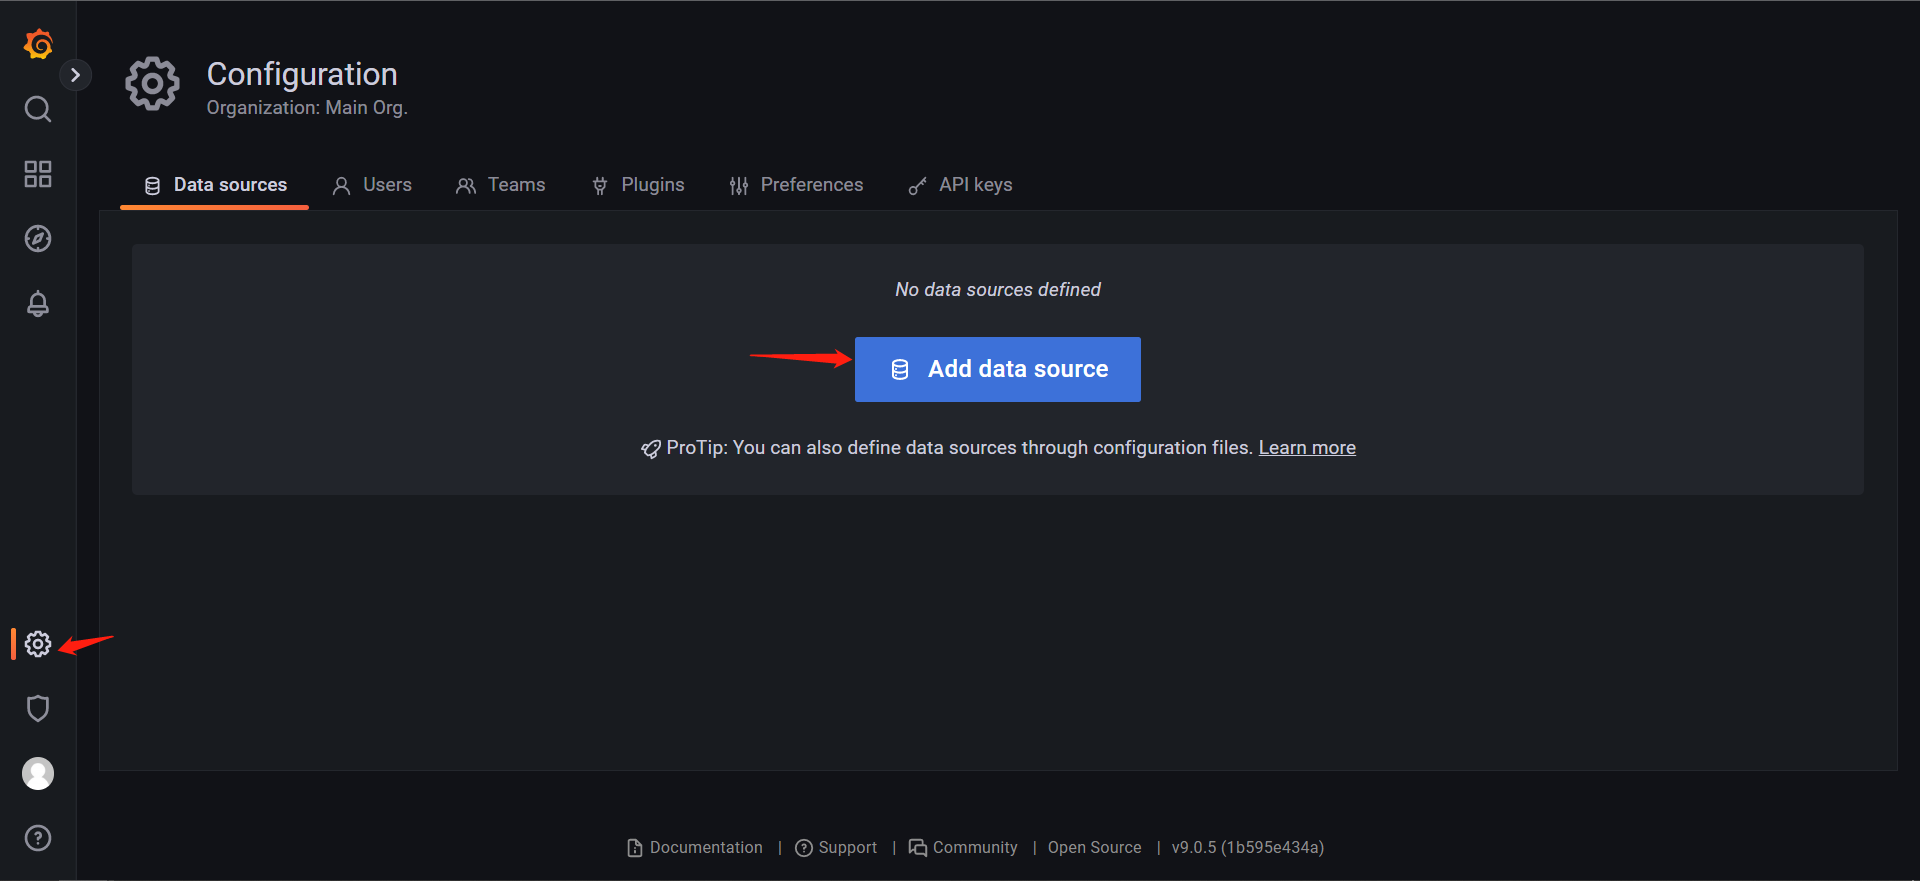
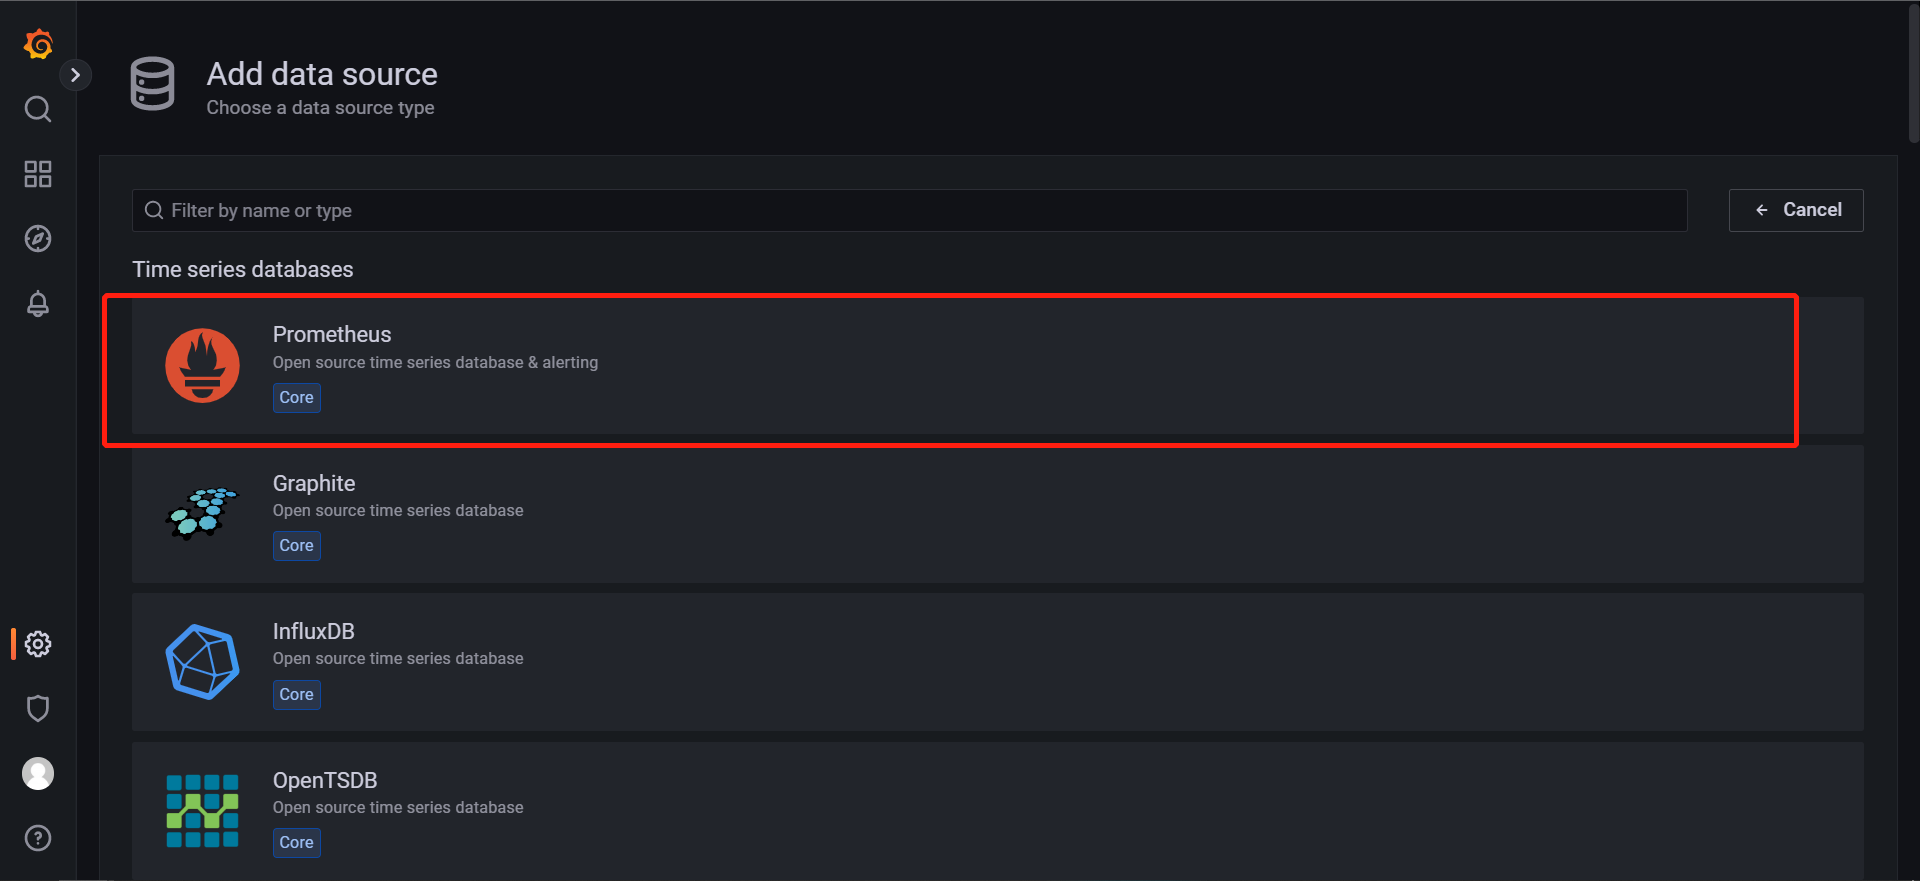
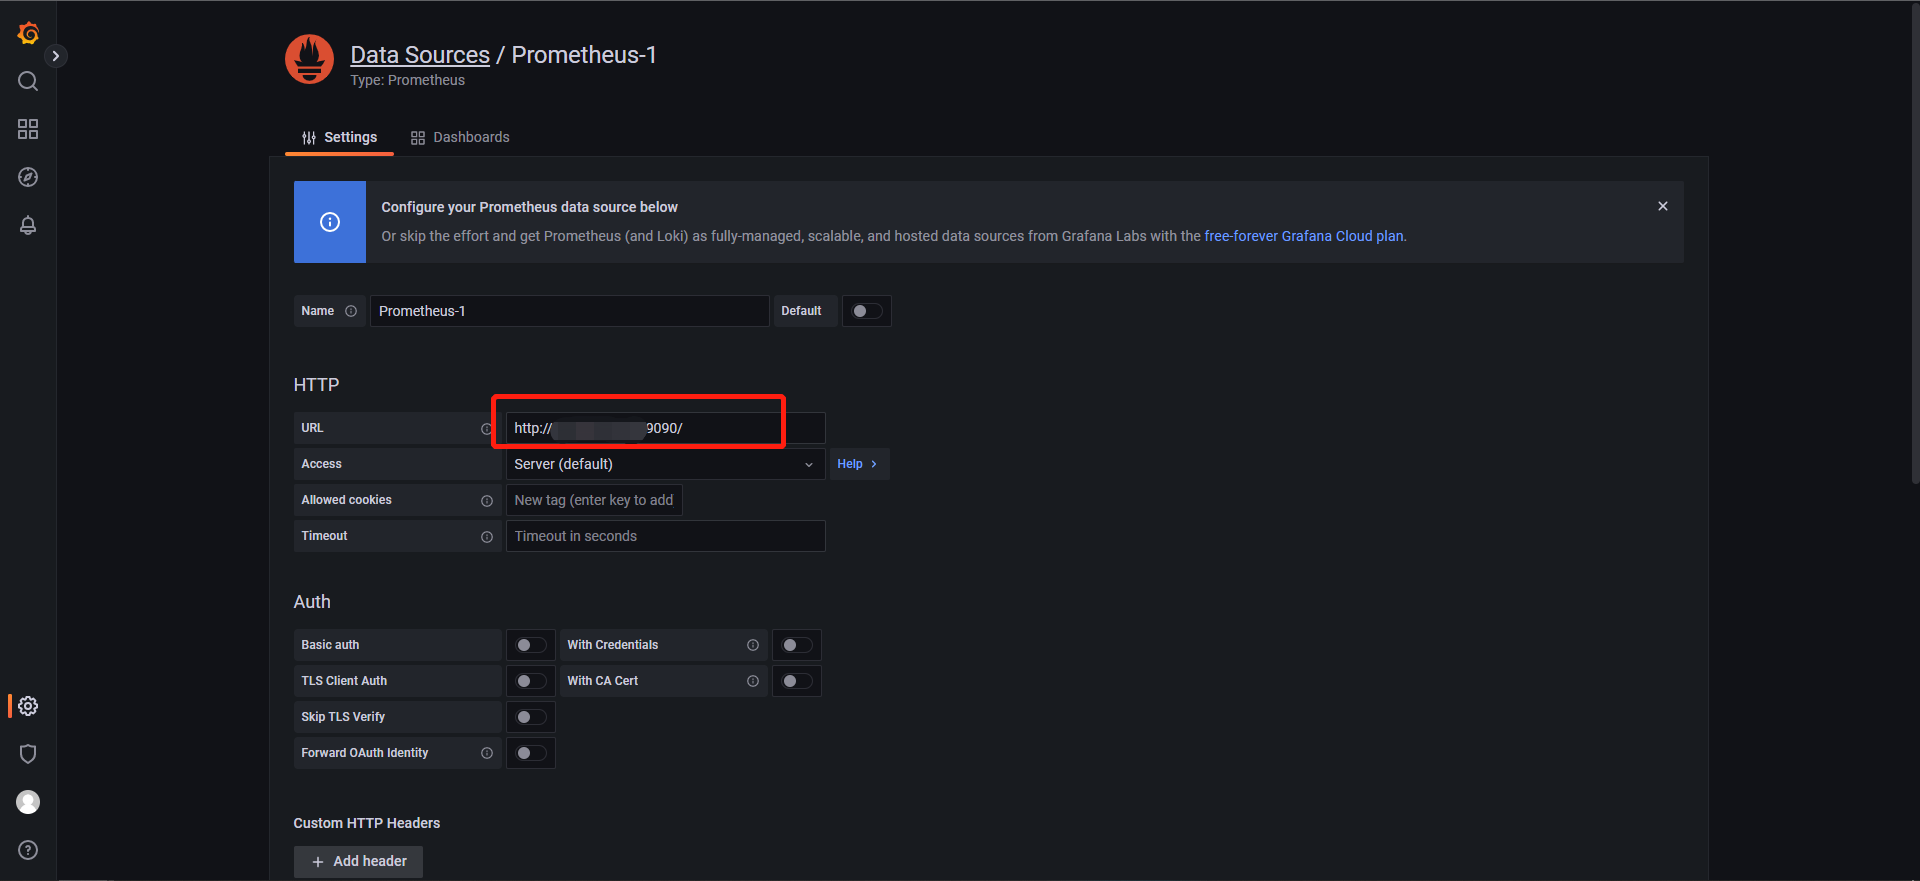
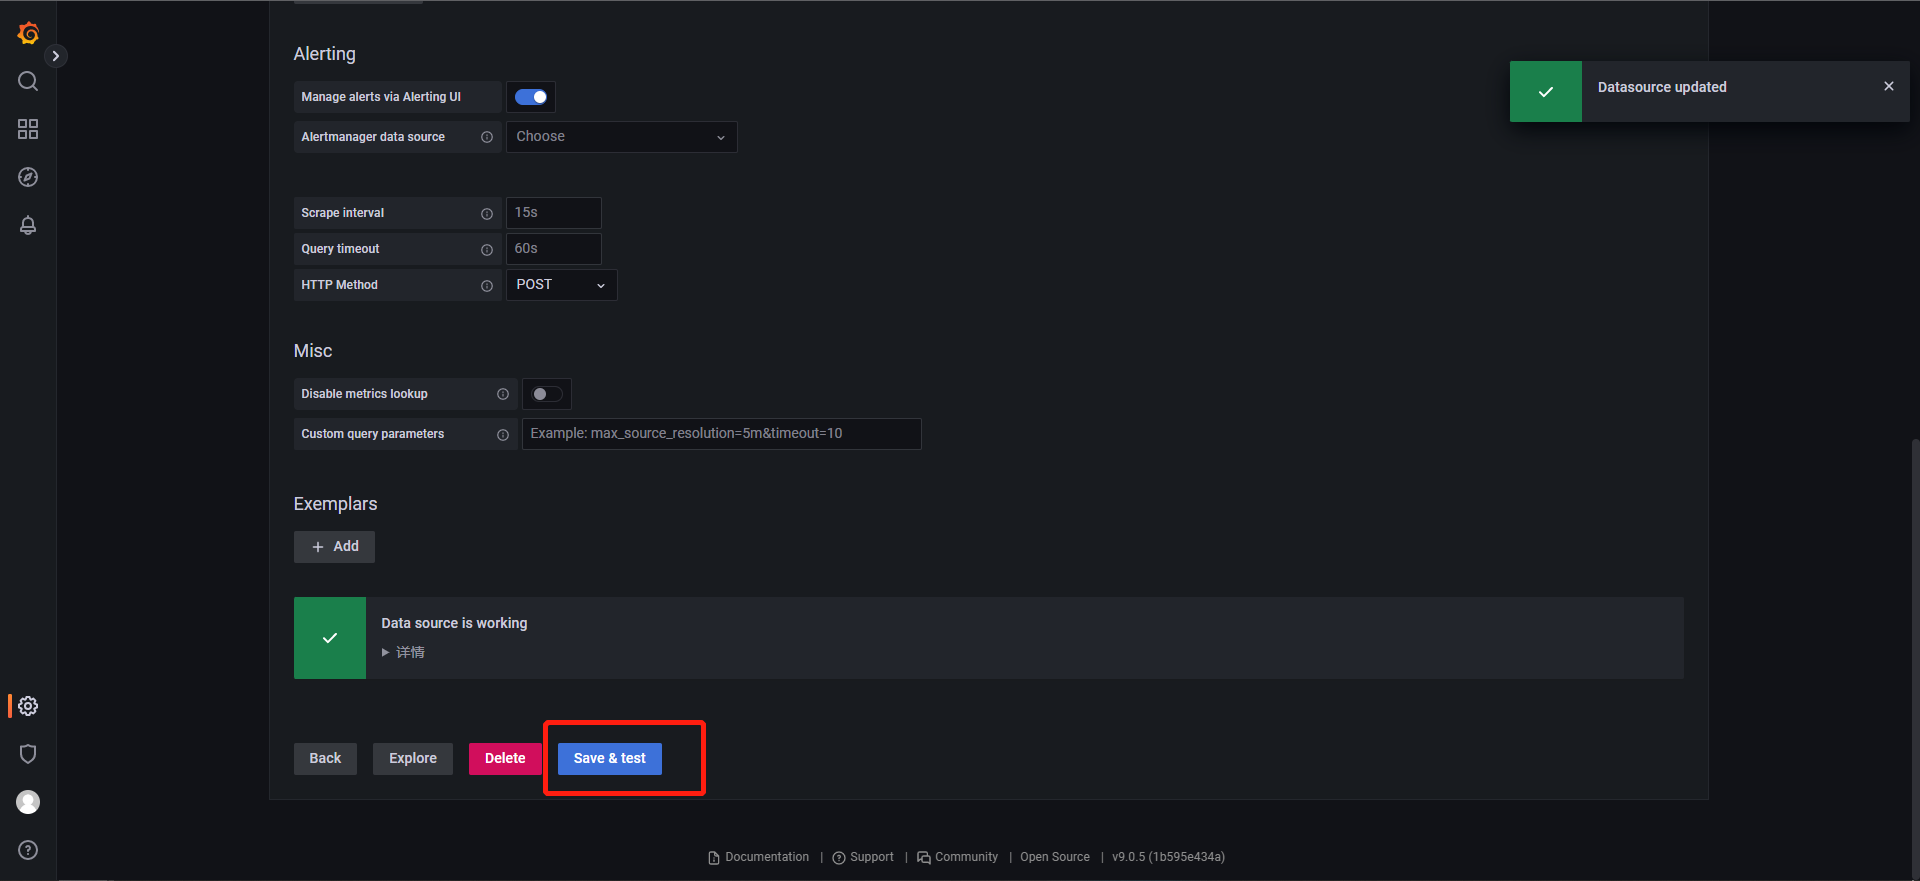
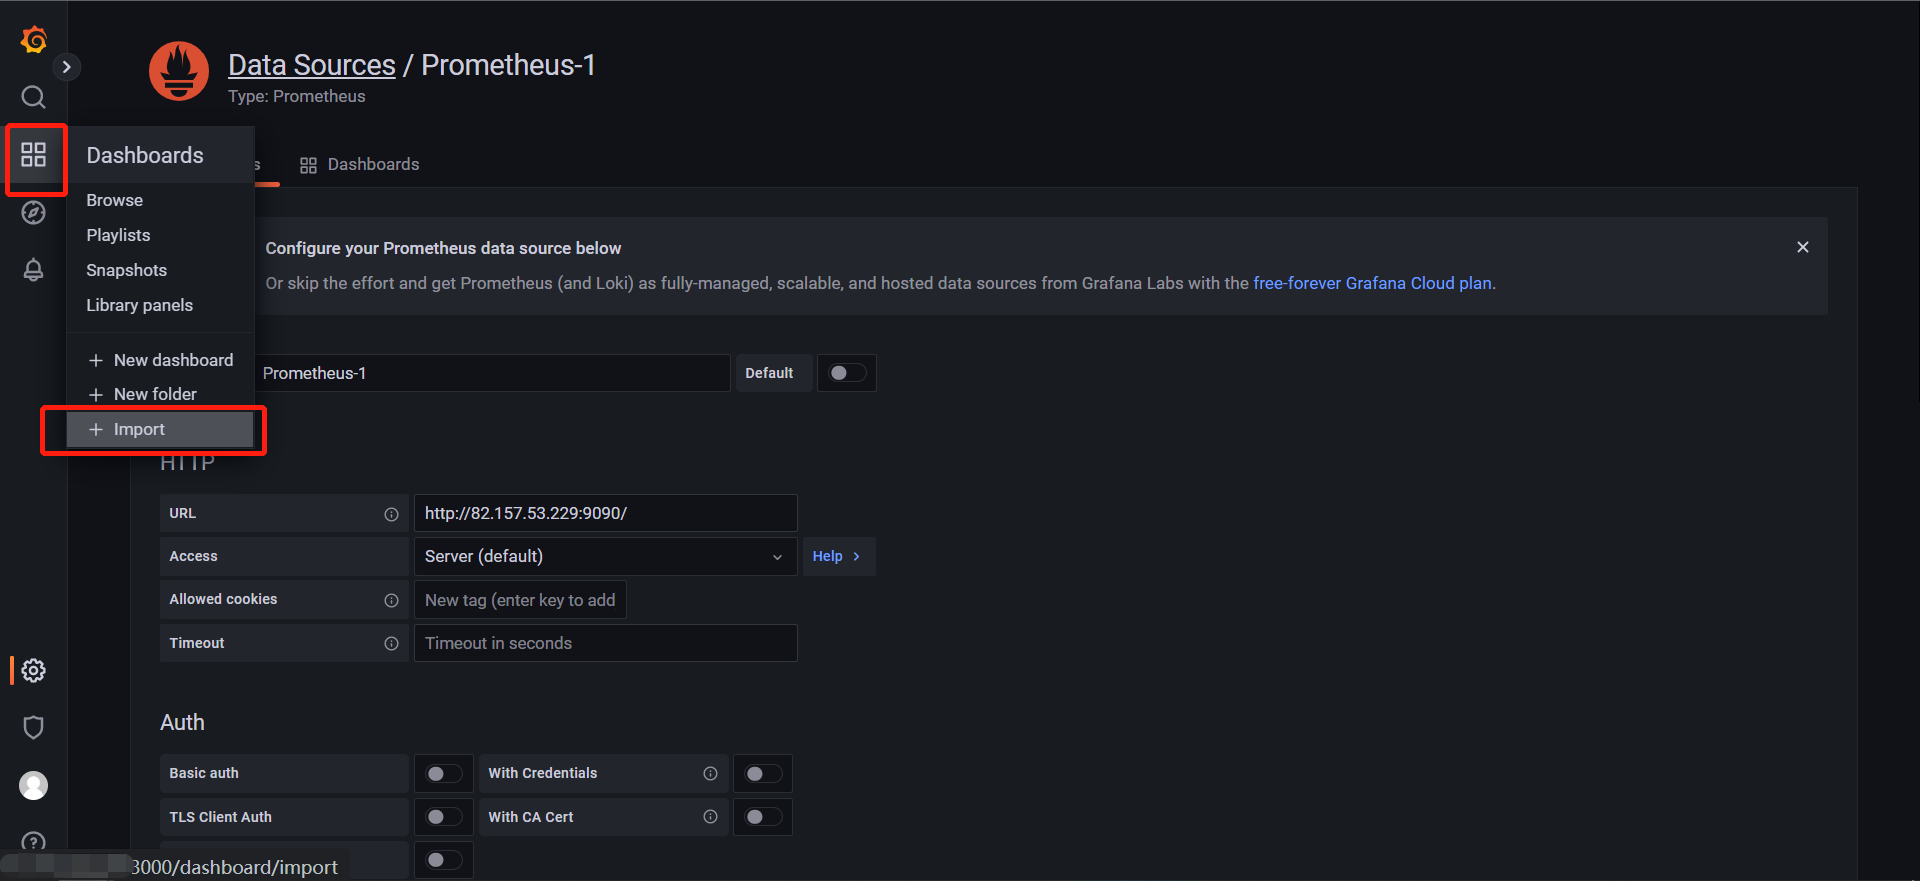
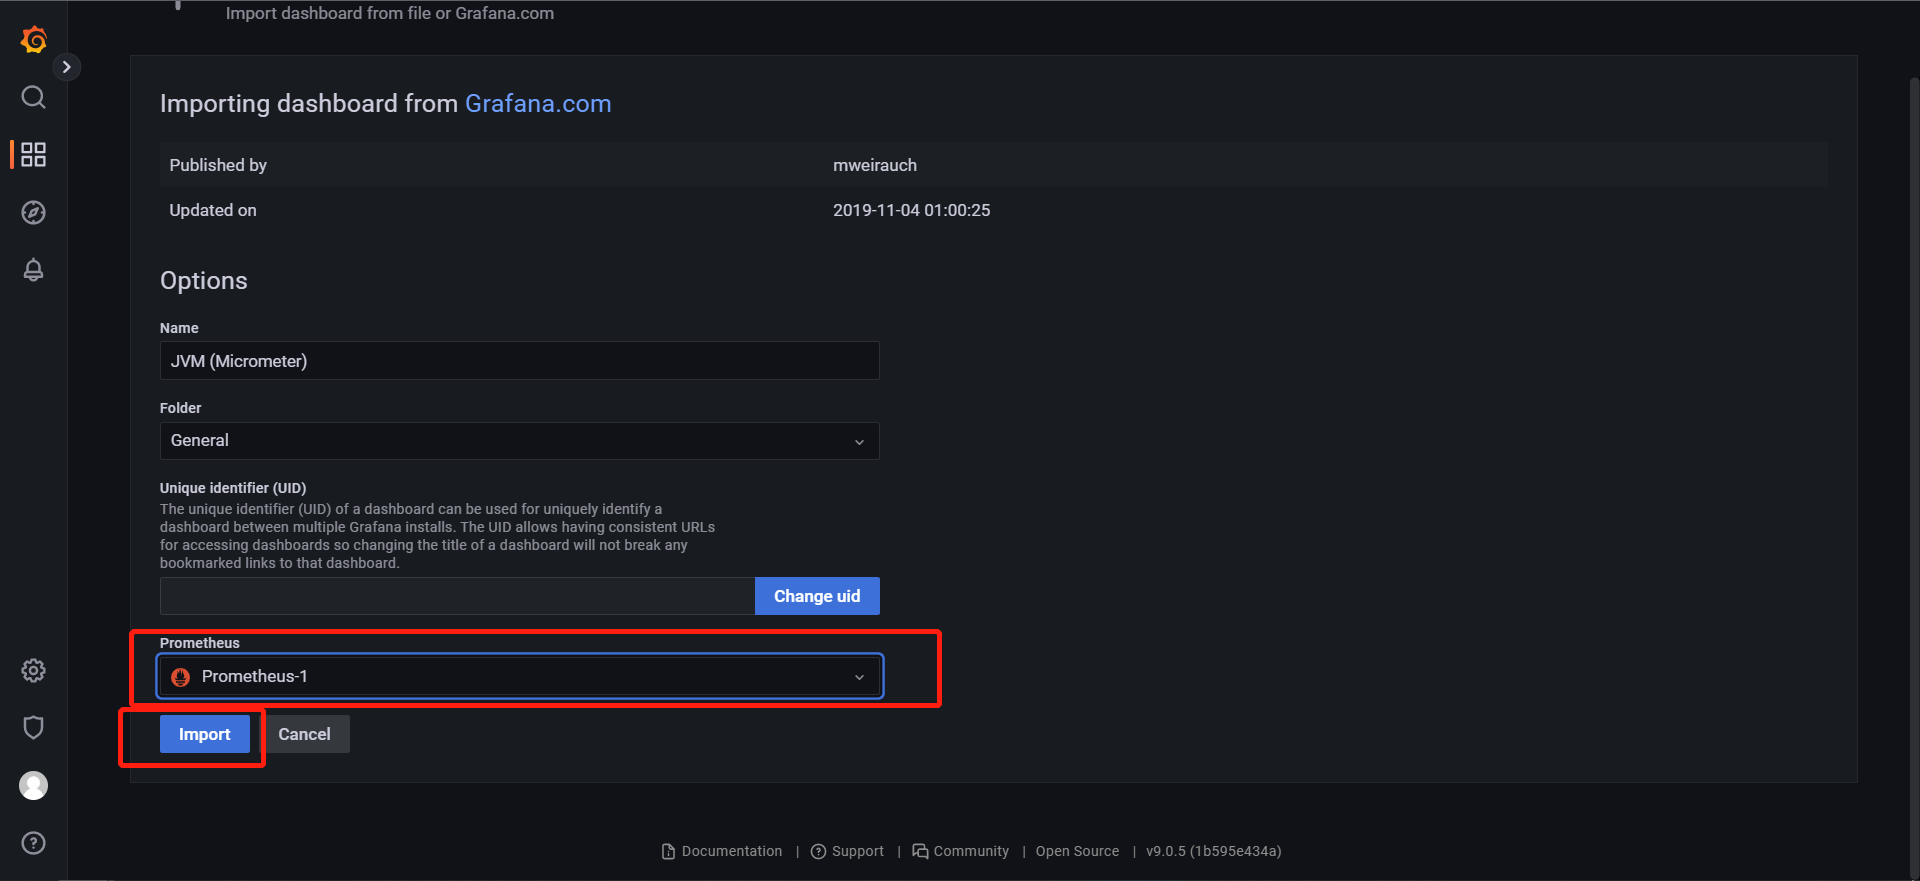
📐第 3 步 :指定数据源
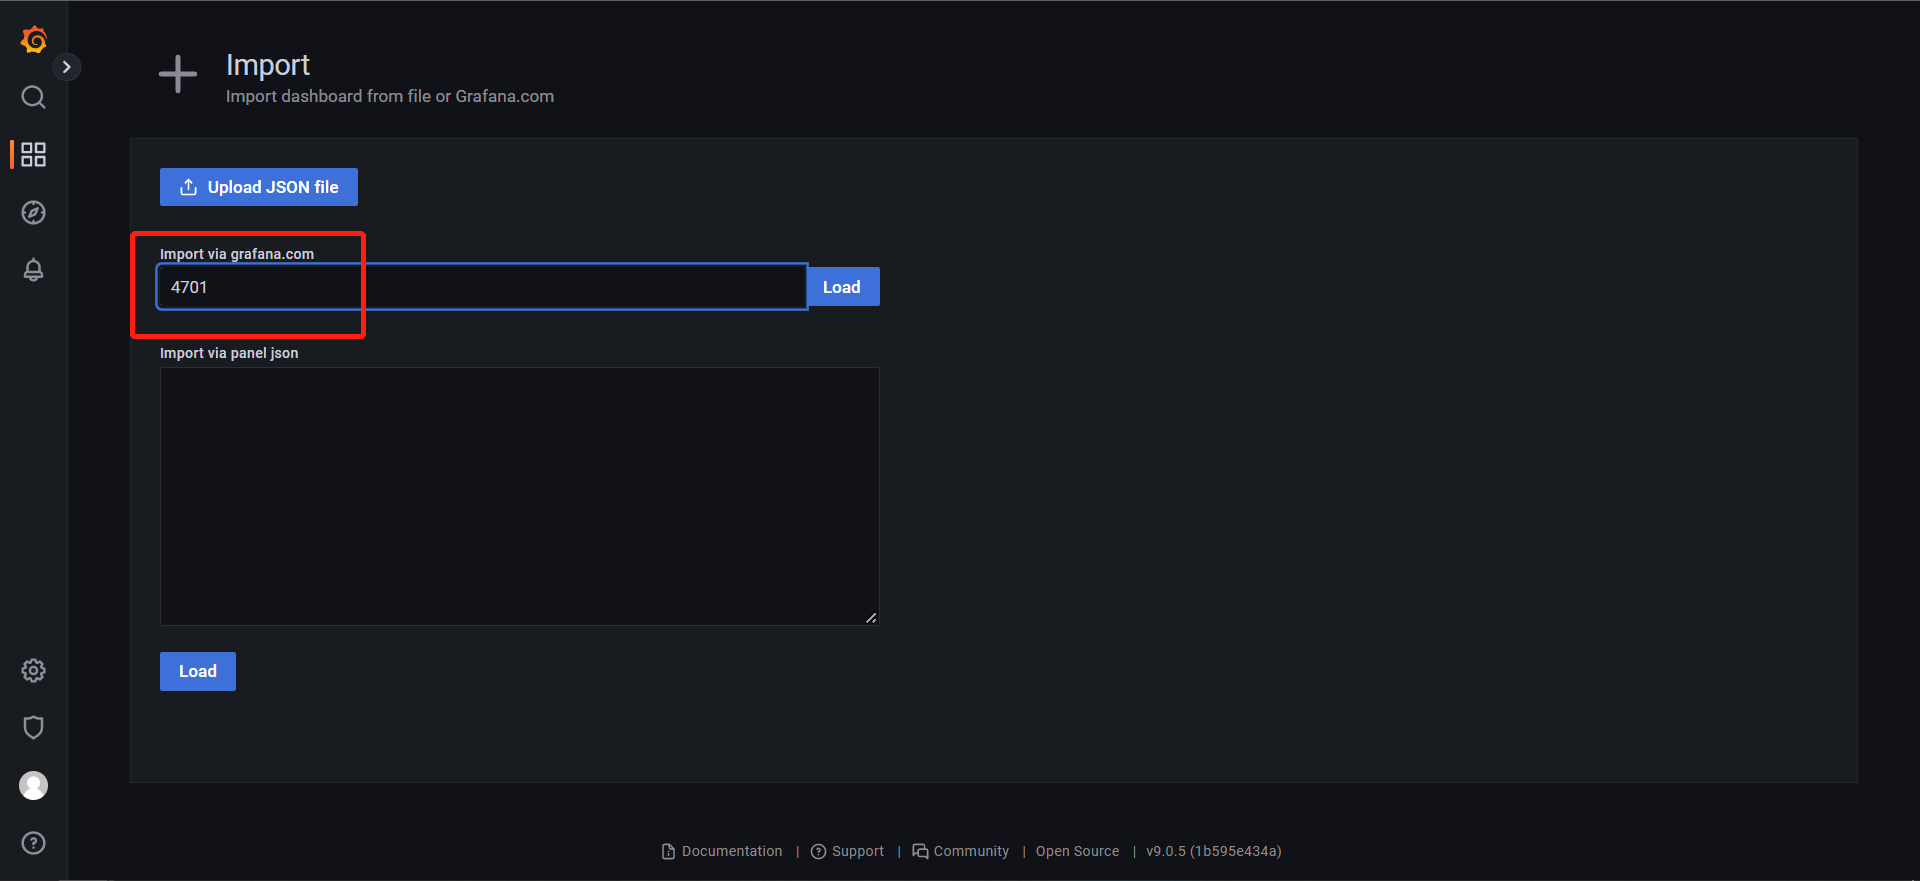
4701是针对springboot项目的。
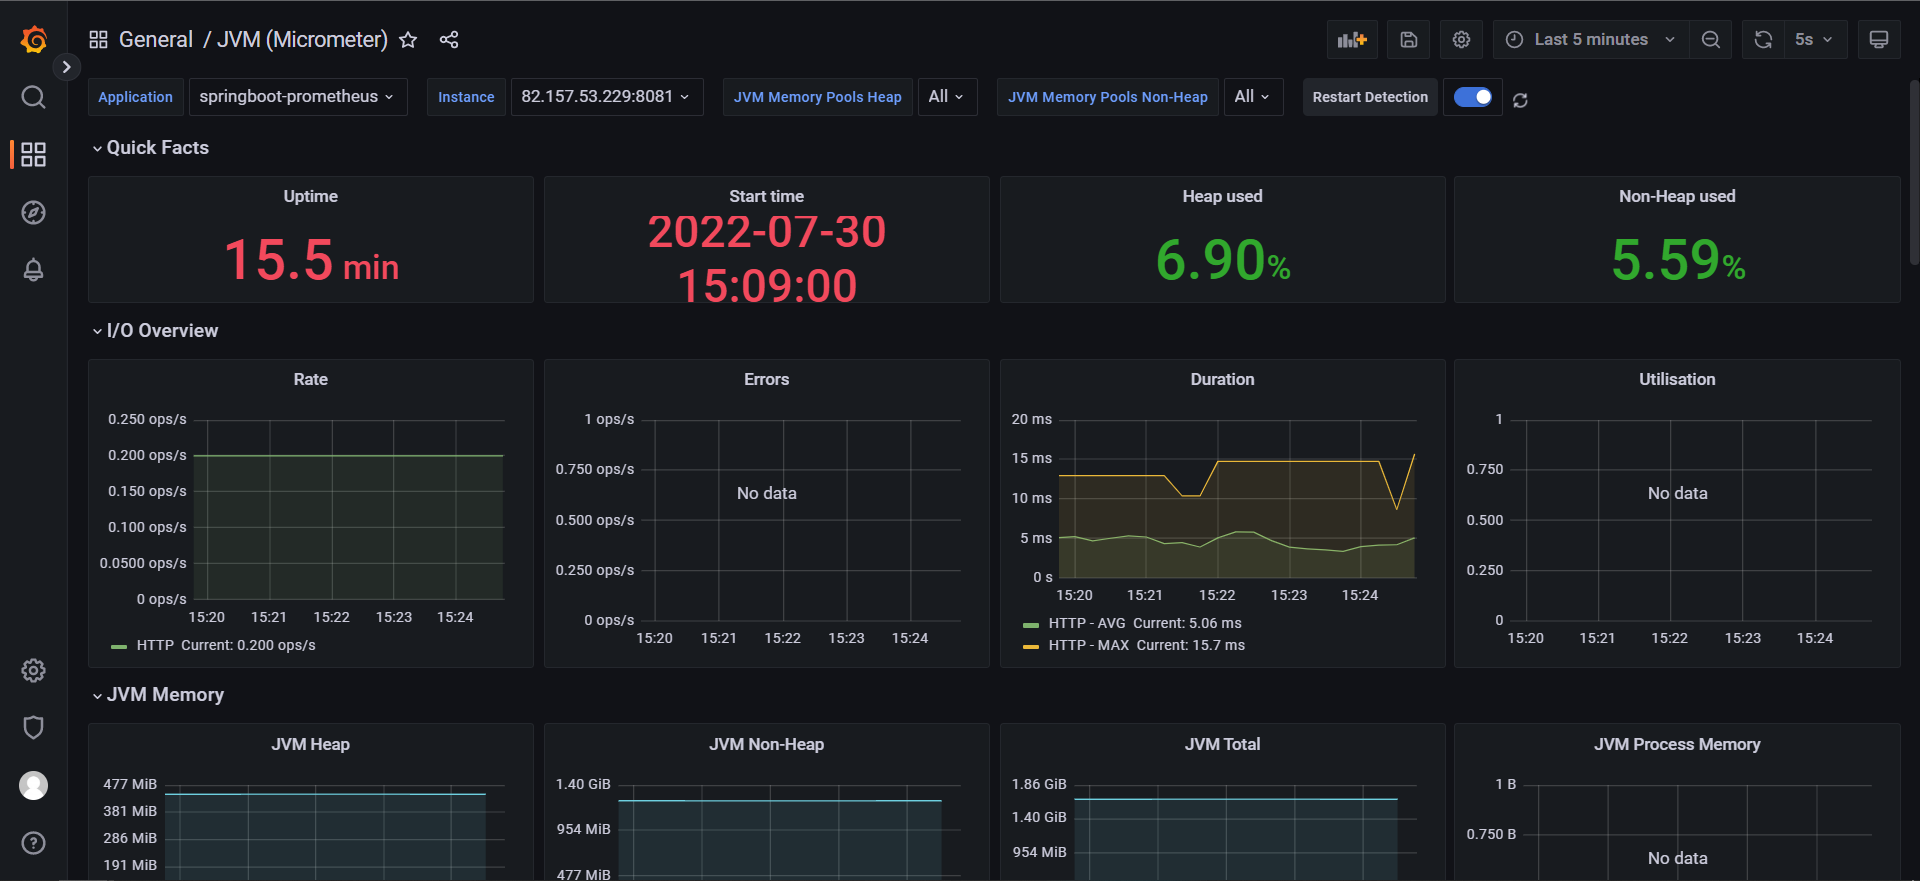
📐第 3 步:查看结果
🍚总结
通过Prometheus与Grafana,成功监控springboot项目的运行状态,像是jvm等一些指标都能够可视化出来。
Written By 知识浅谈
本文来自互联网用户投稿,文章观点仅代表作者本人,不代表本站立场,不承担相关法律责任。如若转载,请注明出处。 如若内容造成侵权/违法违规/事实不符,请点击【内容举报】进行投诉反馈!