Prometheus容器状态监控
目录 ==>
测试开发系列文章
准备工作不重要,不感兴趣可直接从第二节开始
准备工作
代码见于 https://gitee.com/bbjg001/stress_locust
在Locust压力测试中,为了测试启动了一个简单的http服务。为了使CPU、内存的使用效果更明显,这里在其基础上做了一点改动,改变原来读数据库的方式为读写文件。
#!/usr/local/bin/python
import numpy as np
from socketserver import ThreadingMixIn
from http.server import HTTPServer
from http.server import SimpleHTTPRequestHandler
from sys import argv
import logging
from .data_generate import getEmployeedef dataOperateFile(eid):with open('/data/work_data/data.data') as f:lines = f.read().splitlines()ee = []for line in lines:ei = line.split(' ')if eid==str(ei[0]):ee = eibreakif ee:lines.remove(line)lines.append(getEmployee(id=eid))with open('/data/work_data/data.data', 'w') as f:f.write('\n'.join(lines))return {'name': ee[1], 'age': ee[2], 'sex': '女' if ee[3] == '0' else '男'}return 'no this employee by eid={}'.format(eid)class ThreadingServer(ThreadingMixIn, HTTPServer):passclass RequestHandler(SimpleHTTPRequestHandler):def do_GET(self):self.send_response(200)self.send_header('Content-type', 'text/plain;charset=utf-8')try:eid = int(self.path[1:])except:eid = -1response = dataOperateFile(eid)logging.info('request of {} by eid={}'.format(response, eid))self.end_headers()self.wfile.write(str(response).encode())def run(server_class=ThreadingServer, handler_class=RequestHandler, port=8888):server_address = ('0.0.0.0', port)httpd = server_class(server_address, handler_class)logging.info('server start in http://{}:{}'.format(*server_address))try:httpd.serve_forever()except KeyboardInterrupt:passhttpd.server_close()def main():logging.basicConfig(level=logging.INFO, format='%(levelname)-8s %(asctime)s: %(message)s',datefmt='%m-%d %H:%M')if len(argv) == 2:run(port=int(argv[1]))else:run()if __name__ == '__main__':main()
这次通过起一个容器来部署这个http服务,Dockerfile文件如下。
FROM python:3.9ARG wd=/data/work_dataWORKDIR $wd
ENV WORKDIR $wd
ENV SERVERMOD fileRUN mkdir -p $wdCOPY . ${wd}/RUN pip install pipreqs && \pip install -r requirements.txtENV TZ=Asia/Shanghai
RUN ln -snf /usr/share/zoneinfo/$TZ /etc/localtime && echo $TZ > /etc/timezoneENTRYPOINT ["python"]
# 构建镜像
docker build -t iserver -f Dockerfile .
# 构建容器,8088端口给http服务,9100给node_exporter
docker run -tid --name tserver -p 8088:8088 -p 9100:9100 --net host --cpus 2 -m 2G iserver
# 进入容器
docker exec -it tserver bash	# 构建数据文件
python data_generate.py
# 启动http服务
python testserver.py 8088
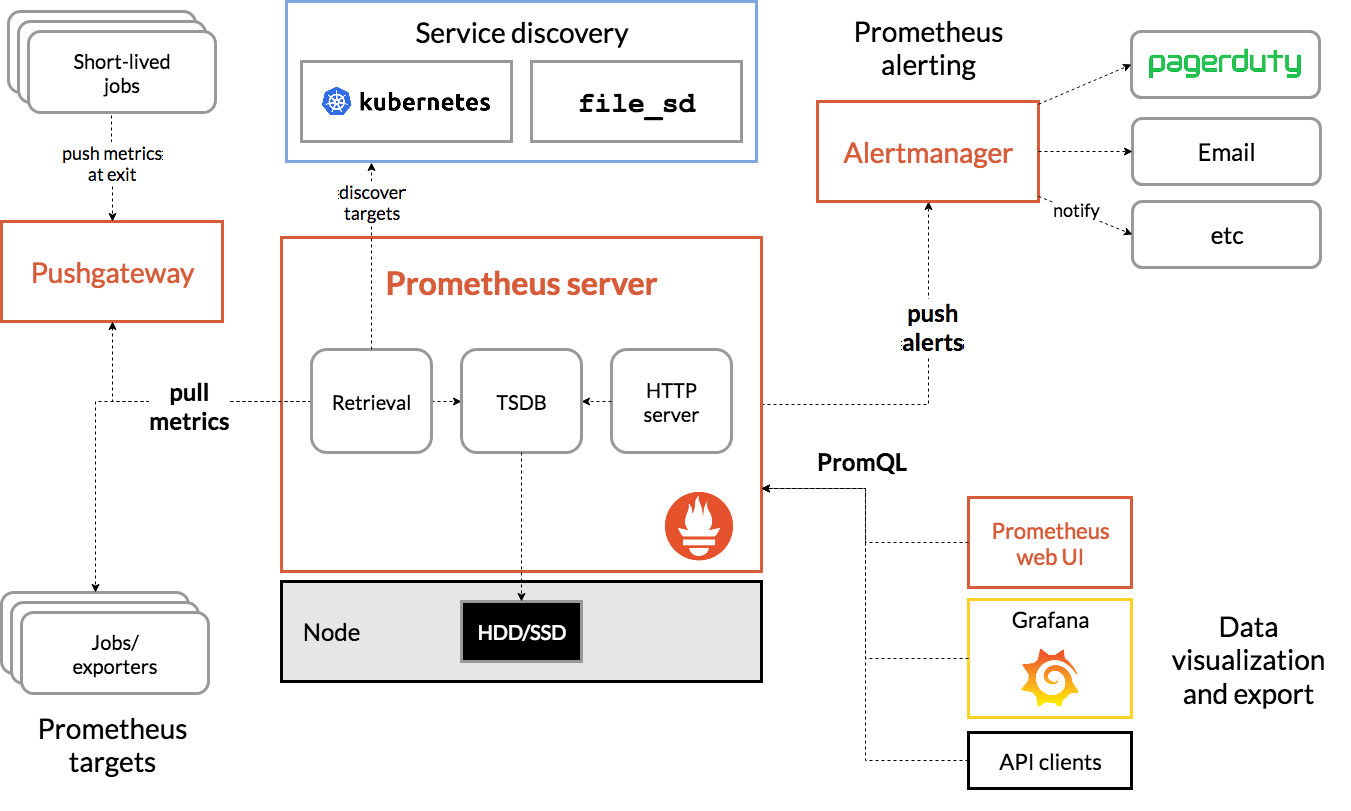
Prometheus
https://prometheus.io/
开始:https://prometheus.io/docs/prometheus/latest/getting_started/
是一个中间节点,可以接收各种监控器穿上来的监控数据
压缩包安装
可以在这里拿到压缩包的地址,下载并解压
wget https://github.com/prometheus/prometheus/releases/download/v2.32.0-rc.1/prometheus-2.32.0-rc.1.linux-amd64.tar.gz
tar -zxf prometheus-2.32.0-rc.1.linux-amd64.tar.gz
# 鉴于这个名字太冗长了,重命名下
mv prometheus-2.32.0-rc.1.linux-amd64 prometheus
cd prometheus
ls
# prometheus			# 这个是启动文件
# prometheus.yml	# 这个是启动依赖的配置文件
prometheus.yml(部分)
其中的 localhost:9090 是prometheus的启动端口
# A scrape configuration containing exactly one endpoint to scrape:
# Here it's Prometheus itself.
scrape_configs:# The job name is added as a label `job=` to any timeseries scraped from this config.- job_name: "prometheus"# metrics_path defaults to '/metrics'# scheme defaults to 'http'.static_configs:- targets: ["localhost:9090"]
启动它
./prometheus --config.file=prometheus.yml
最后一条日志显示已经启动
[外链图片转存失败,源站可能有防盗链机制,建议将图片保存下来直接上传(img-GGSQxVqa-1642353046174)(/Users/darcyzhang/Library/Application%20Support/typora-user-images/image-20211211001856185.png)]
此时即可通过前端访问prometheus的管理监控界面
http://192.168.5.217:9090/ # 请换成自己的ip
docker安装
作为另外的安装方式,通过上面的方式安装了不必要再装一次
构造配置文件,会映射给docker容器
vim prometheus.yml
# my global config
global:scrape_interval: 15s # Set the scrape interval to every 15 seconds. Default is every 1 minute.evaluation_interval: 15s # Evaluate rules every 15 seconds. The default is every 1 minute.# scrape_timeout is set to the global default (10s).# Alertmanager configuration
alerting:alertmanagers:- static_configs:- targets:# - alertmanager:9093# Load rules once and periodically evaluate them according to the global 'evaluation_interval'.
rule_files:# - "first_rules.yml"# - "second_rules.yml"# A scrape configuration containing exactly one endpoint to scrape:
# Here it's Prometheus itself.
scrape_configs:# The job name is added as a label `job=` to any timeseries scraped from this config. - job_name: 'prometheus'# metrics_path defaults to '/metrics'# scheme defaults to 'http'.static_configs:- targets: ['localhost:9090']
# 启动它
docker run  -d \--name prometheus \-p 9090:9090 \-v /data/zy/work_data/moni_dev/configs/prometheus.yml:/etc/prometheus/prometheus.yml  \prom/prometheus
exporter
个人理解Prometheus是一个中间组件,真正需要采集数据的是exporter。prometheus提供了一系列的exporter供选择。这里使用node_exporter做演示。
找到node_export,拿到链接,去把它下载到容器上启动
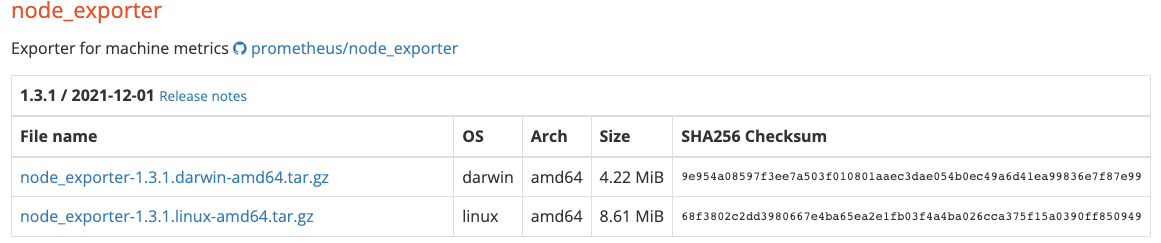
wget https://github.com/prometheus/node_exporter/releases/download/v1.3.1/node_exporter-1.3.1.linux-amd64.tar.gz
tar -zxf node_exporter-1.3.1.linux-amd64.tar.gz
mv node_exporter-1.3.1.linux-amd64 node_exporter		# 没啥,就是换个简单的名字
cd node_exporter
# 启动它
./node_exporter

日志显示成功启动,默认监听9100端口
./node_exporter --help		# 查看参数信息
# 其中设置端口的参数
--web.listen-address=":9100"         Address on which to expose metrics and web interface.
下面可以访问这个地址 http://192.168.5.217:9100/metrics查看node_exporter采集到的信息
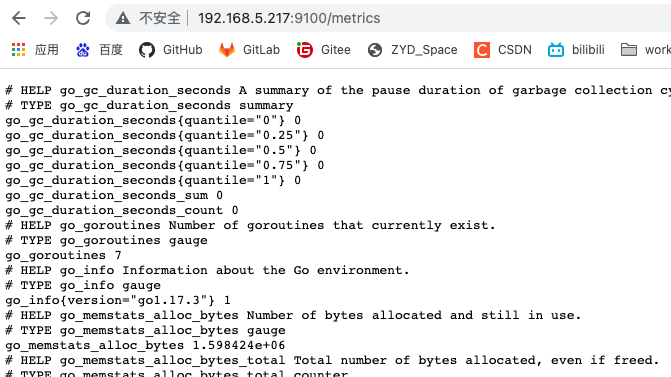
这只有采集到的数据,下面配置Prometheus来采集这些数据
修改prometheus文件夹下的prometheus.yml文件,在最下面添加监听node exporter,注意缩进,job_name与上一个job_name同级。
scrape_configs:# The job name is added as a label `job=` to any timeseries scraped from this config. - job_name: "prometheus"# metrics_path defaults to '/metrics'# scheme defaults to 'http'.static_configs:- targets: ["localhost:9090"]# 这里是新添加的,采集node exporter监控数据- job_name: 'node'static_configs:- targets: ['192.168.5.217:9100'] # 注意改掉localhost,这个地址要在起Prometheus的机器上能访问到
修改完成后重启prometheus
Grafana
官网 https://grafana.com/
下载 https://grafana.com/grafana/download
前端展示面板,展示各种监控指标
安装
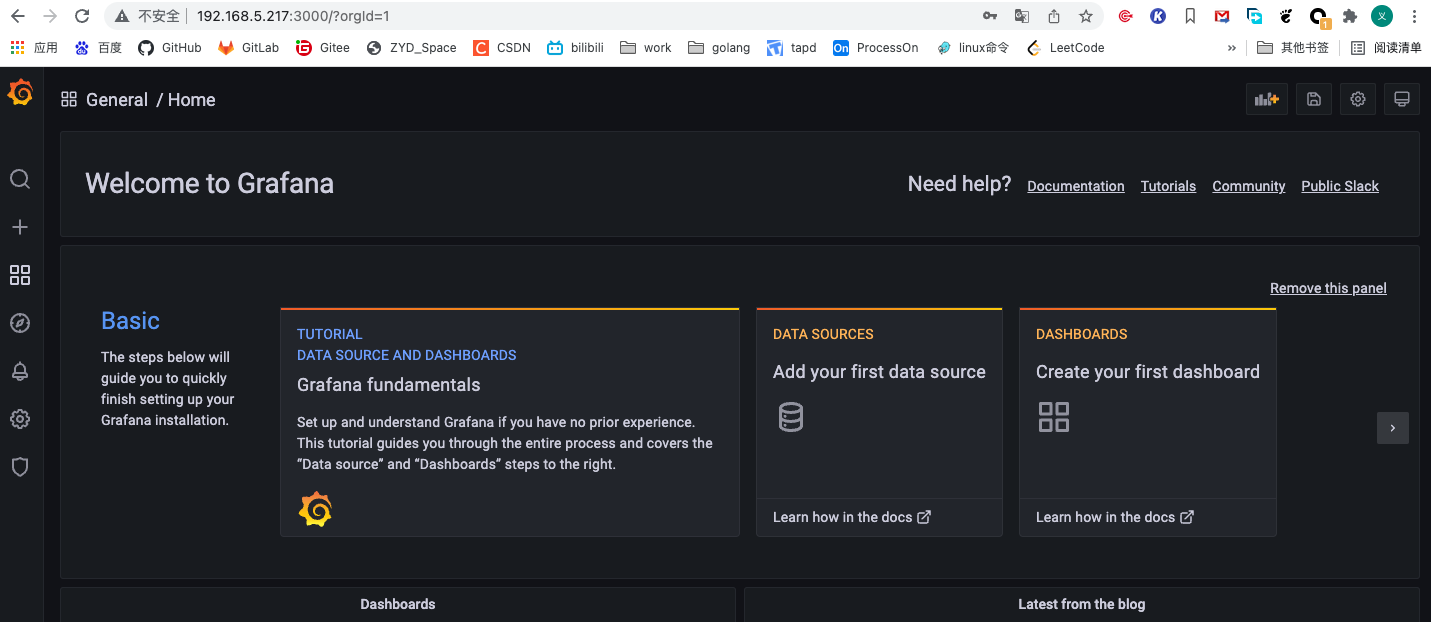
这里我直接通过docker启动了
docker run -d \--name grafana \-p 3000:3000 \-v /data/zy/work_data/moni_dev/data/grafana:/var/lib/grafana \--privileged \grafana/grafana 可以通过对应的端口进行访问,登录的默认用户名和密码都是 admin
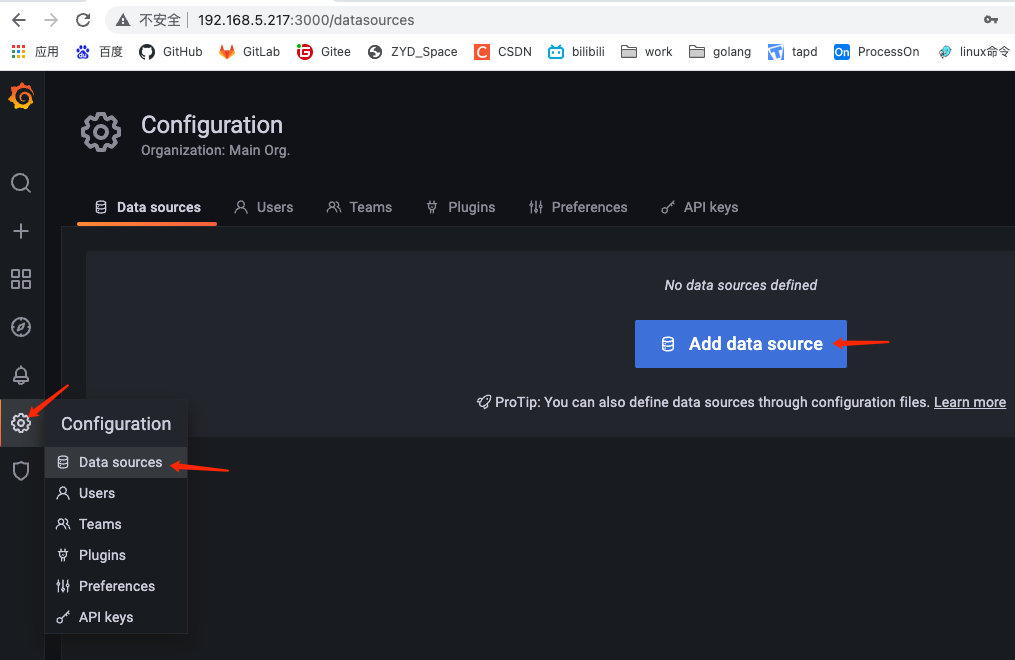
添加数据源Prometheus
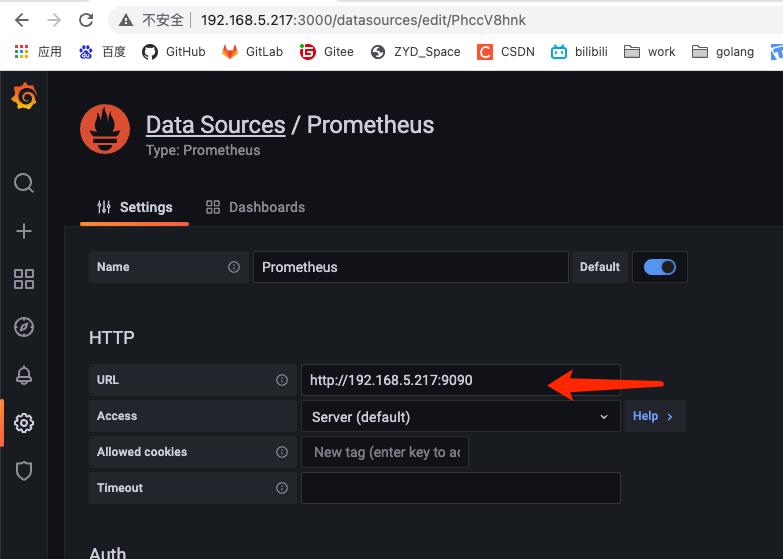
选择Prometheus
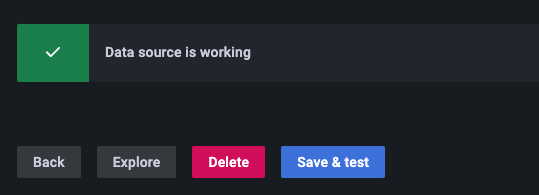
下滑到最下方 Save & test
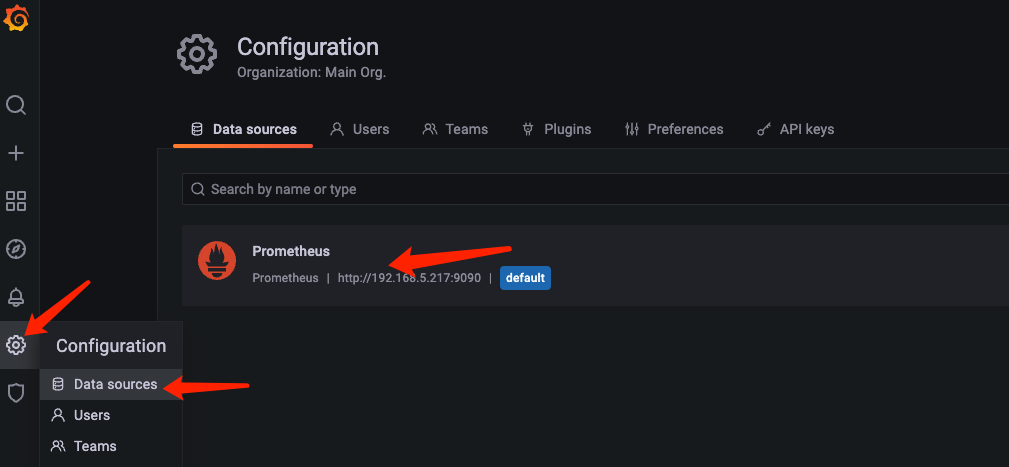
选择Prometheus
视自己需求选择导入的仪表盘
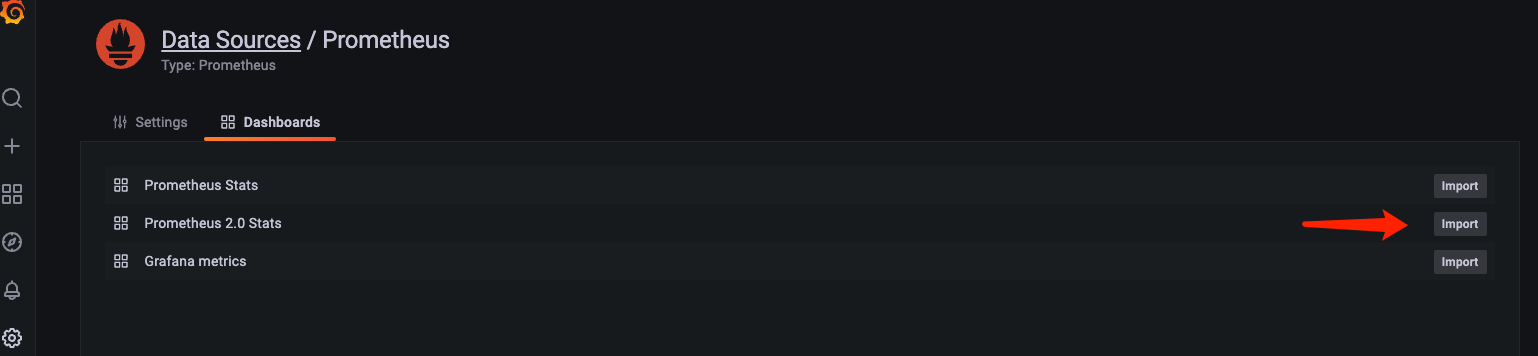
导入仪表盘样式
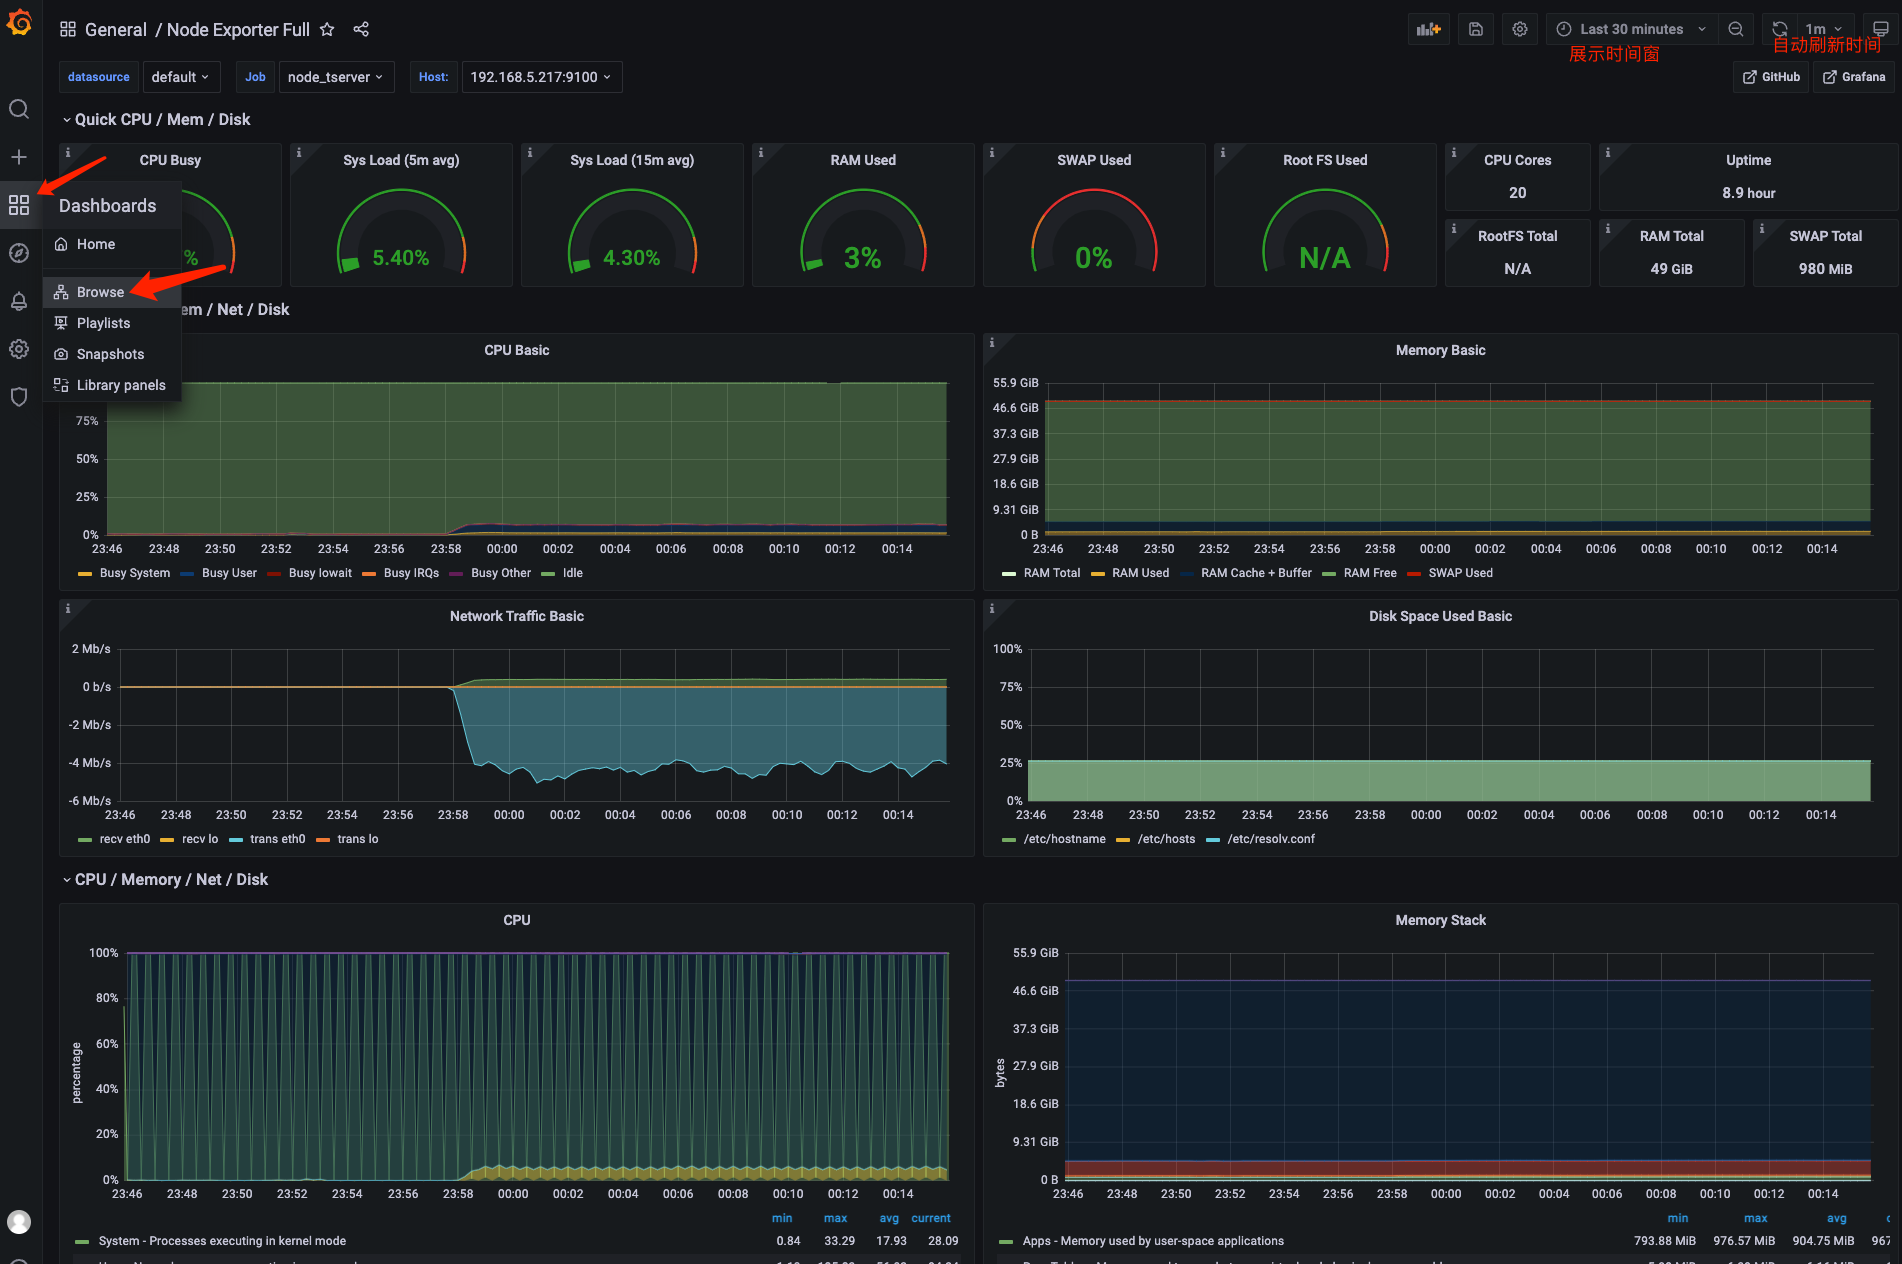
grana也提供了很多仪表盘样式,这里选择下载比较多的Node Exporter Full做演示。
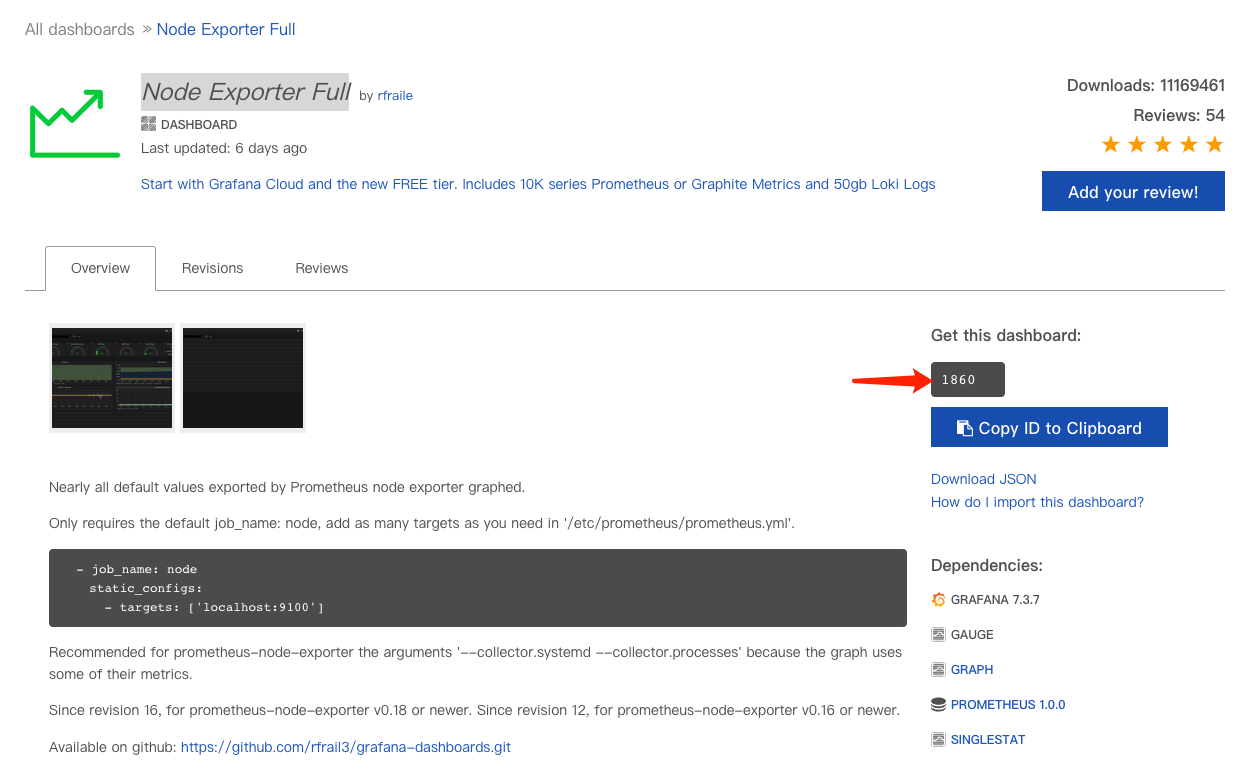
点击左侧Create->Import,
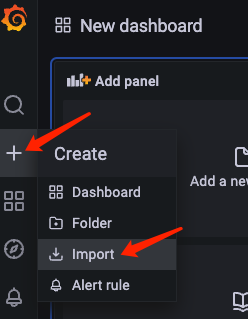
在弹出界面填入仪表盘id 1860,点击Load。选择Prometheus,点击Import。
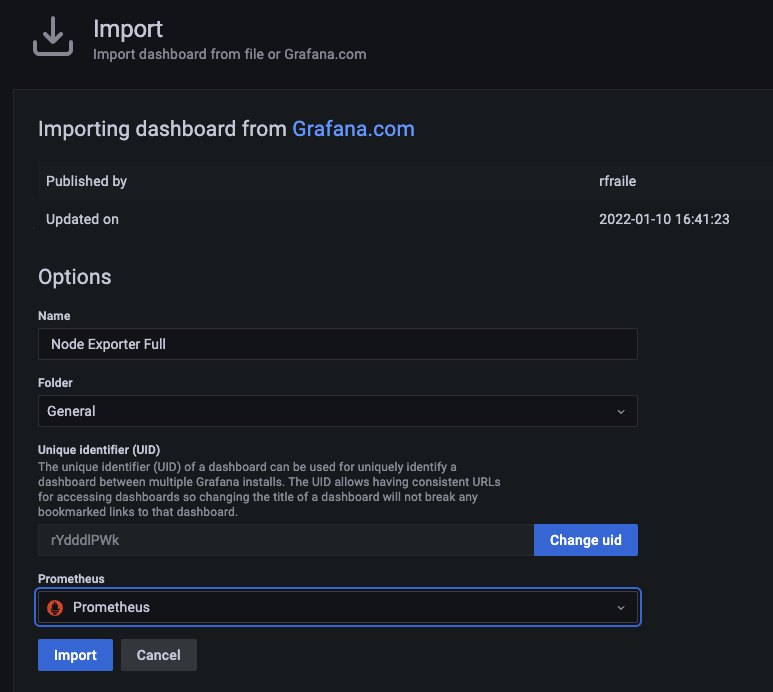
导入后即可弹出仪表盘,再次进入可以从Dashboards->Browser进入。(其中发生变动的节点是启动了Locust压力测试中的压测)
如果要增加对其他机器的监控,按exporter部分重复操作即可(在对应机器上启动exporter,在prometheus.yml配置文件中配置这个exporter)
参考
Grafana监控系统之Prometheus+Grafana监控系统搭建
https://prometheus.io/docs/introduction/overview/
本文来自互联网用户投稿,文章观点仅代表作者本人,不代表本站立场,不承担相关法律责任。如若转载,请注明出处。 如若内容造成侵权/违法违规/事实不符,请点击【内容举报】进行投诉反馈!