DBSCAN 聚类算法与实例分析
DBSCAN 聚类算法与实例分析
DBSCAN 聚类算法
density-based spatial clustering of applications with noise (DBSCAN,具有噪声的基于密度的聚类方法)
- 不需要预先指定 cluster 的个数。
- 最终 cluster 的个数不确定。
DBSCAN 聚类算法将数据点分为 3 类:
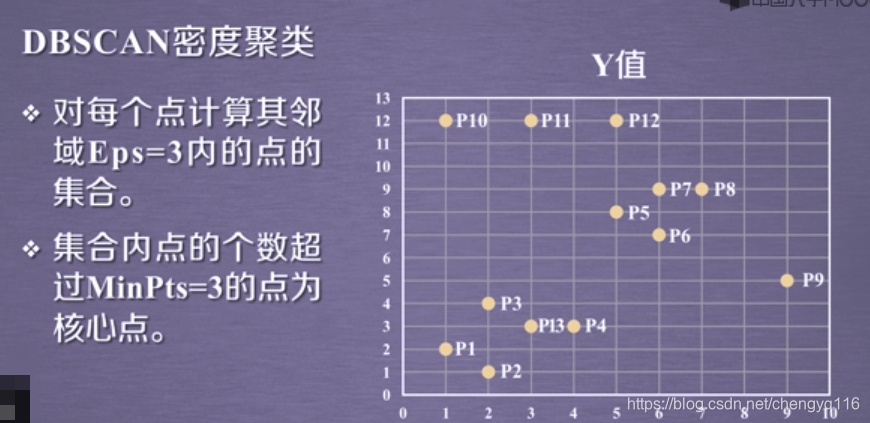
- 核心点:在半径 Eps 内含有超过 MinPts 数目的点。
- 边界点:在半径 Eps 内点的数量小于 MinPts,但是落在核心点的邻域内的点。
- 噪音点:既不是核心点也不是边界点的点。

图中黄色的点为边界点,在半径 Eps 内,它领域内的点不超过 MinPts 个。设置 MinPts=5,中间白色的点称为核心点,因为它邻域内的点是超过 MinPts=5 个点的,它邻域内的点就是黄色的点。
每组连通的核心点形成一个 cluster,将每个边界点指派到一个与之关联的核心点的 cluster 中 (任一个核心点的半径范围之内)。


出租车几何或曼哈顿距离 (Manhattan distance)


sklearn.cluster.DBSCAN(eps=0.5, min_samples=5, metric='euclidean')
eps: The maximum distance between two samples for them to be considered as in the same neighborhood.
min_samples: The number of samples (or total weight) in a neighborhood for a point to be considered as a core point. This includes the point itself.
metric: The metric to use when calculating distance between instances in a feature array.
In mathematics, the Euclidean distance or Euclidean metric is the “ordinary” straight-line distance between two points in Euclidean space.
在数学中,欧几里得距离或欧几里得度量是欧几里得空间中两点间普通 (即直线) 距离。
数据分布与聚类分析
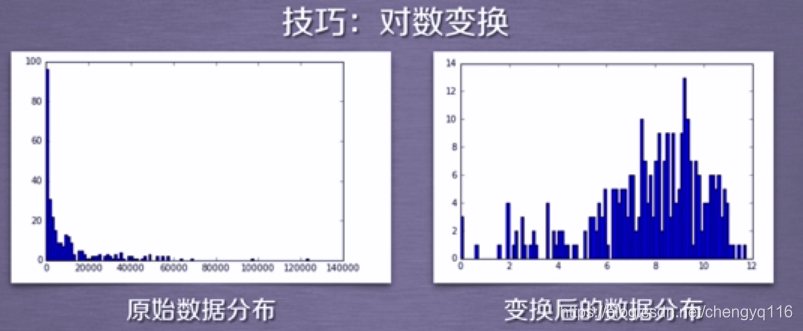
机器学习技巧。左边的数据分布不适用于聚类分析。如果对这类数据进行聚类分析,需要对这些数据进行一些数学变换,通常我们采用取对数的变换方法。变换后的数据比较适用于聚类分析。
实例分析
https://www.cnblogs.com/python-machine/p/6941949.html
本文来自互联网用户投稿,文章观点仅代表作者本人,不代表本站立场,不承担相关法律责任。如若转载,请注明出处。 如若内容造成侵权/违法违规/事实不符,请点击【内容举报】进行投诉反馈!