Python做多维度分类的聚合运算、环比、同比
目录
- 1.目标:
- 2.背景:
- 3.观察数据:
- 4.计算步骤、思路
- 5.多维度分类的聚合运算
1.目标:
按月求三个重要指标:
- 用户数
- 销量
- 销售额
在每个维度的总和,或者每个分类的环比、同比。
2.背景:
一家国外品牌的自行车生产公司,在中国拥有三个代理商帮助销售其品牌产品,该品牌的自行在中国车十分畅销,在各个地区都有其用户。
该场景下的维度有:
- 时间维度
- 产品维度
- 地区维度
- 代理商维度
- 消费者维度
以月为单位就算,计算各维度中某分类的总和、同比、环比
3.观察数据:
Dataframe里每一行代表一位客人在某一天购买的一辆单车。
有83285条的订单记录,26列
df.shape
#(83285, 26)df.info()
'''

Int64Index: 83285 entries, 0 to 83342
Data columns (total 26 columns):#   Column  Non-Null Count  Dtype
---  ------  --------------  -----  0   创建日期    83285 non-null  object 1   创建年月    83285 non-null  object 2   季度      83285 non-null  int64  3   一年的周数   83285 non-null  int64  4   星期      83285 non-null  int64  5   当月的天数   83285 non-null  int64  6   两年的周数   83285 non-null  int64  7   是否今天    83285 non-null  int64  8   订单ID    83285 non-null  float649   客户ID    83285 non-null  int64  10  商品ID    83285 non-null  object 11  商品名     83285 non-null  object 12  商品子类    83285 non-null  object 13  商品类别    83285 non-null  object 14  价格      83285 non-null  float6415  客户创建日期  83285 non-null  object 16  出生日期    83285 non-null  object 17  性别      83285 non-null  object 18  婚否      83285 non-null  object 19  年收入     83285 non-null  float6420  省       83285 non-null  object 21  市       83285 non-null  object 22  地区      83285 non-null  object 23  代理商     83285 non-null  object 24  成本      83285 non-null  float6425  渠道      83285 non-null  object
dtypes: float64(4), int64(7), object(15)
memory usage: 17.2+ MB
'''
时间是从2019年1月2日到2020年9月30日
df['创建日期'].value_counts().sort_index()
'''
2019-01-02     85
2019-01-03    104
2019-01-04     98
2019-01-05    101
2019-01-06     84...
2020-09-26    283
2020-09-27    293
2020-09-28    303
2020-09-29    317
2020-09-30    313
Name: 创建日期, Length: 633, dtype: int64
'''
4.计算步骤、思路
聚合后每个分类的三个指标的总和:
- 用groupby对[创建年月,分类字段]进行聚合
- 对客户数,求客户ID唯一值的数量
- 对销量,对订单ID用count求出销量
- 对销售额,对价格(单价)用sum求和
环比:
- 用pivot_table()计算每个月每个分类的各指标
- 用pct_change()计算环比
- 用stack()/reset_index()对多层列/行引索进行处理
- 用rename()重命名字段名
同比:
- 算分类的唯一值
- 对分类分层用for loop,再用pct_change()计算同比
5.多维度分类的聚合运算
以产品维度为例,详细步骤如下:
先观察,查看有多少产品子类
#一共有三个自行车子类:
df['商品子类'].value_counts()'''
df['商品子类'].value_counts()
公路自行车    44131
山地自行车    27266
旅游自行车    11888
Name: 商品子类, dtype: int64
'''
每个子类在每个月的销售表现
#算出了每个分类在每个月的总客户数、销量、销售额
product_category=df.groupby(["创建年月","商品子类"]).agg({"客户ID":pd.Series.nunique,"订单ID":"count","价格":"sum"}).reset_index()
product_category=product_category.rename(columns={"客户ID":"客户数","订单ID":"销量","价格":"销售额"})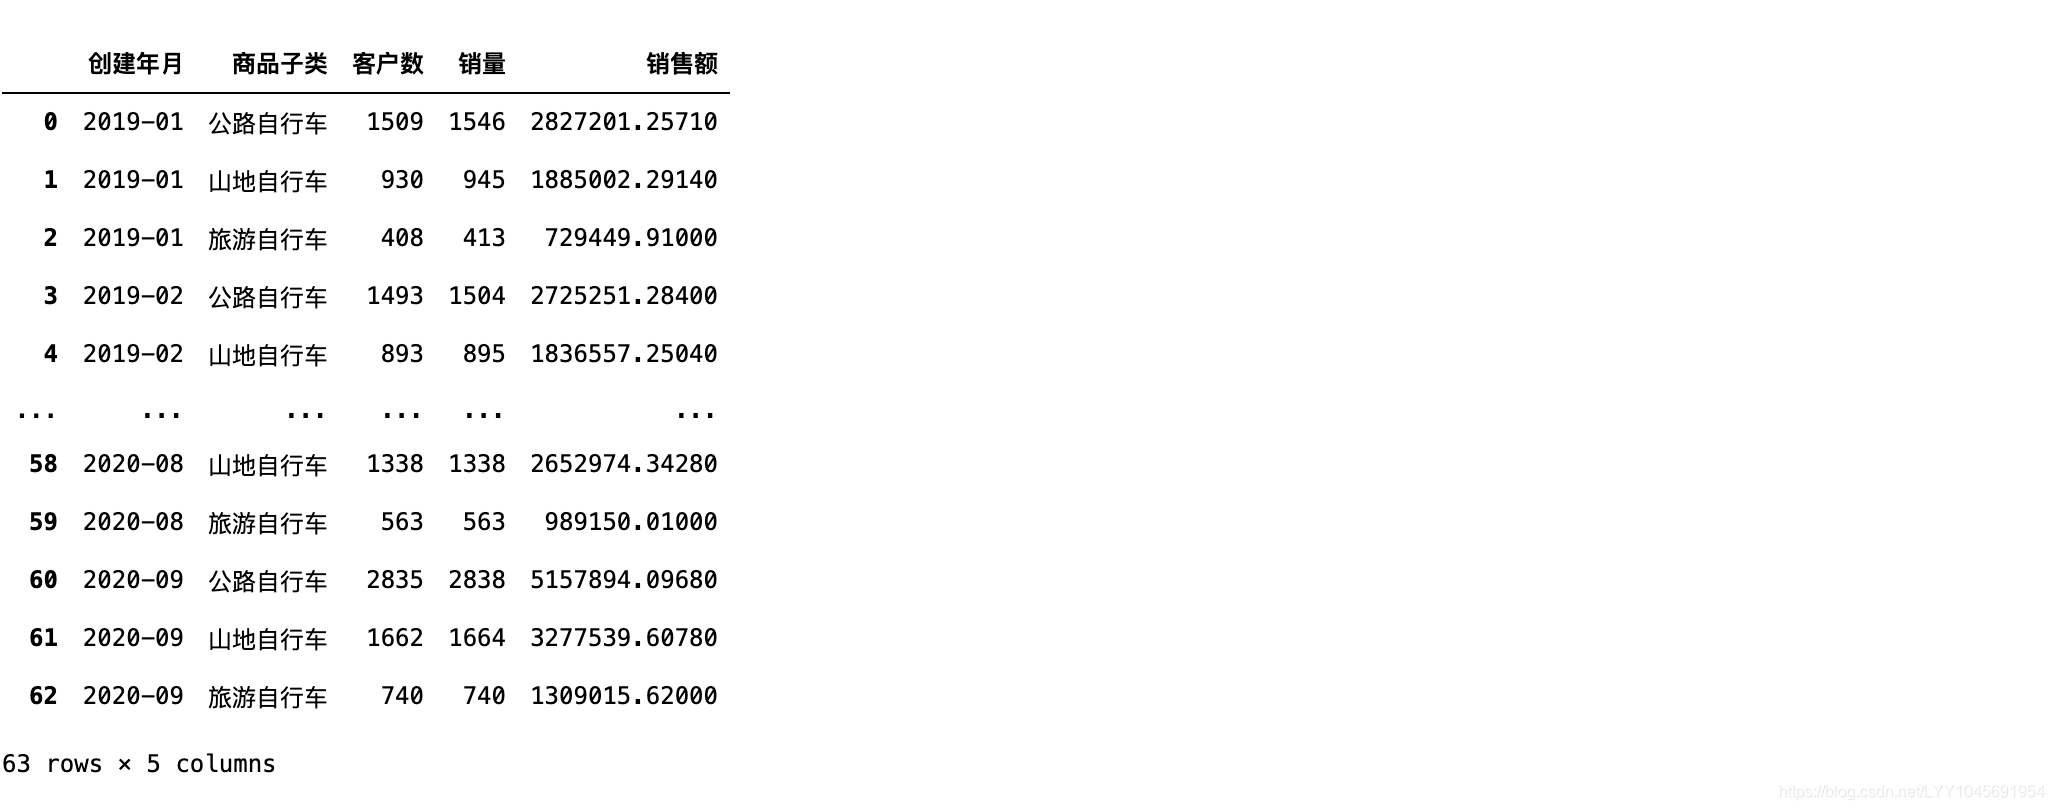
计算环比
先到pivot_table()转化行列
pivot_table()跟Excel的透视表功能一致,能对所需字段进行求和、求平均等。注意values一定要是数值类型,否则不能计算。
pivot_table()官方链接

这里不需要计算,只需要行列转换。
category_diff=product_category.pivot_table(index=["创建年月"],columns=["商品子类"],values=["客户数","销量","销售额"])
pct_change()算环比
pct_change()的能计算变化率,即(后一个值-前一个值)/前一个值,这里因为行引索是按[年-月]顺序,所以能直接用于求环比。
pct_change()官网链接
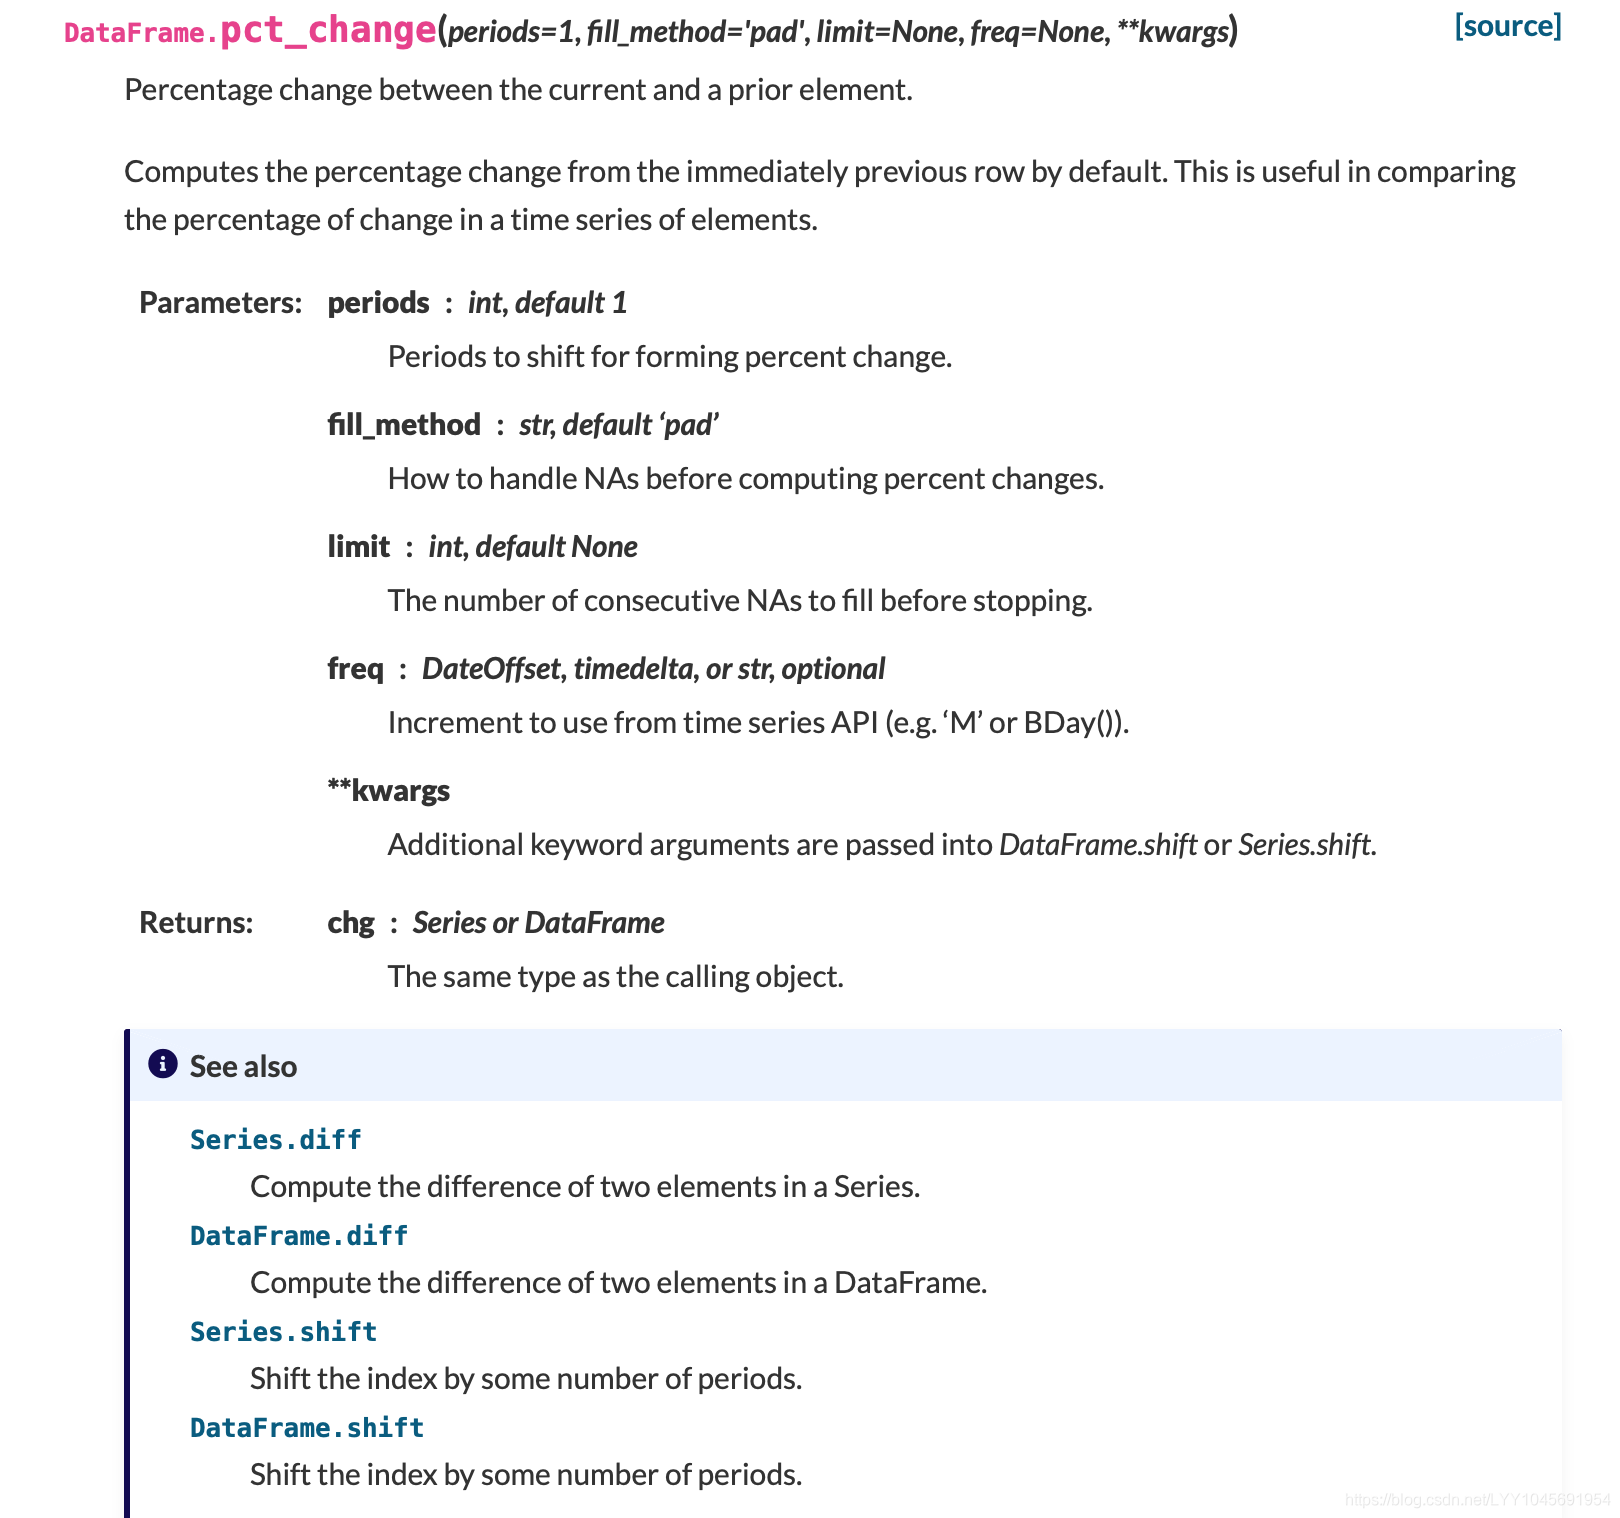
category_diff=category_diff.pct_change()
category_diff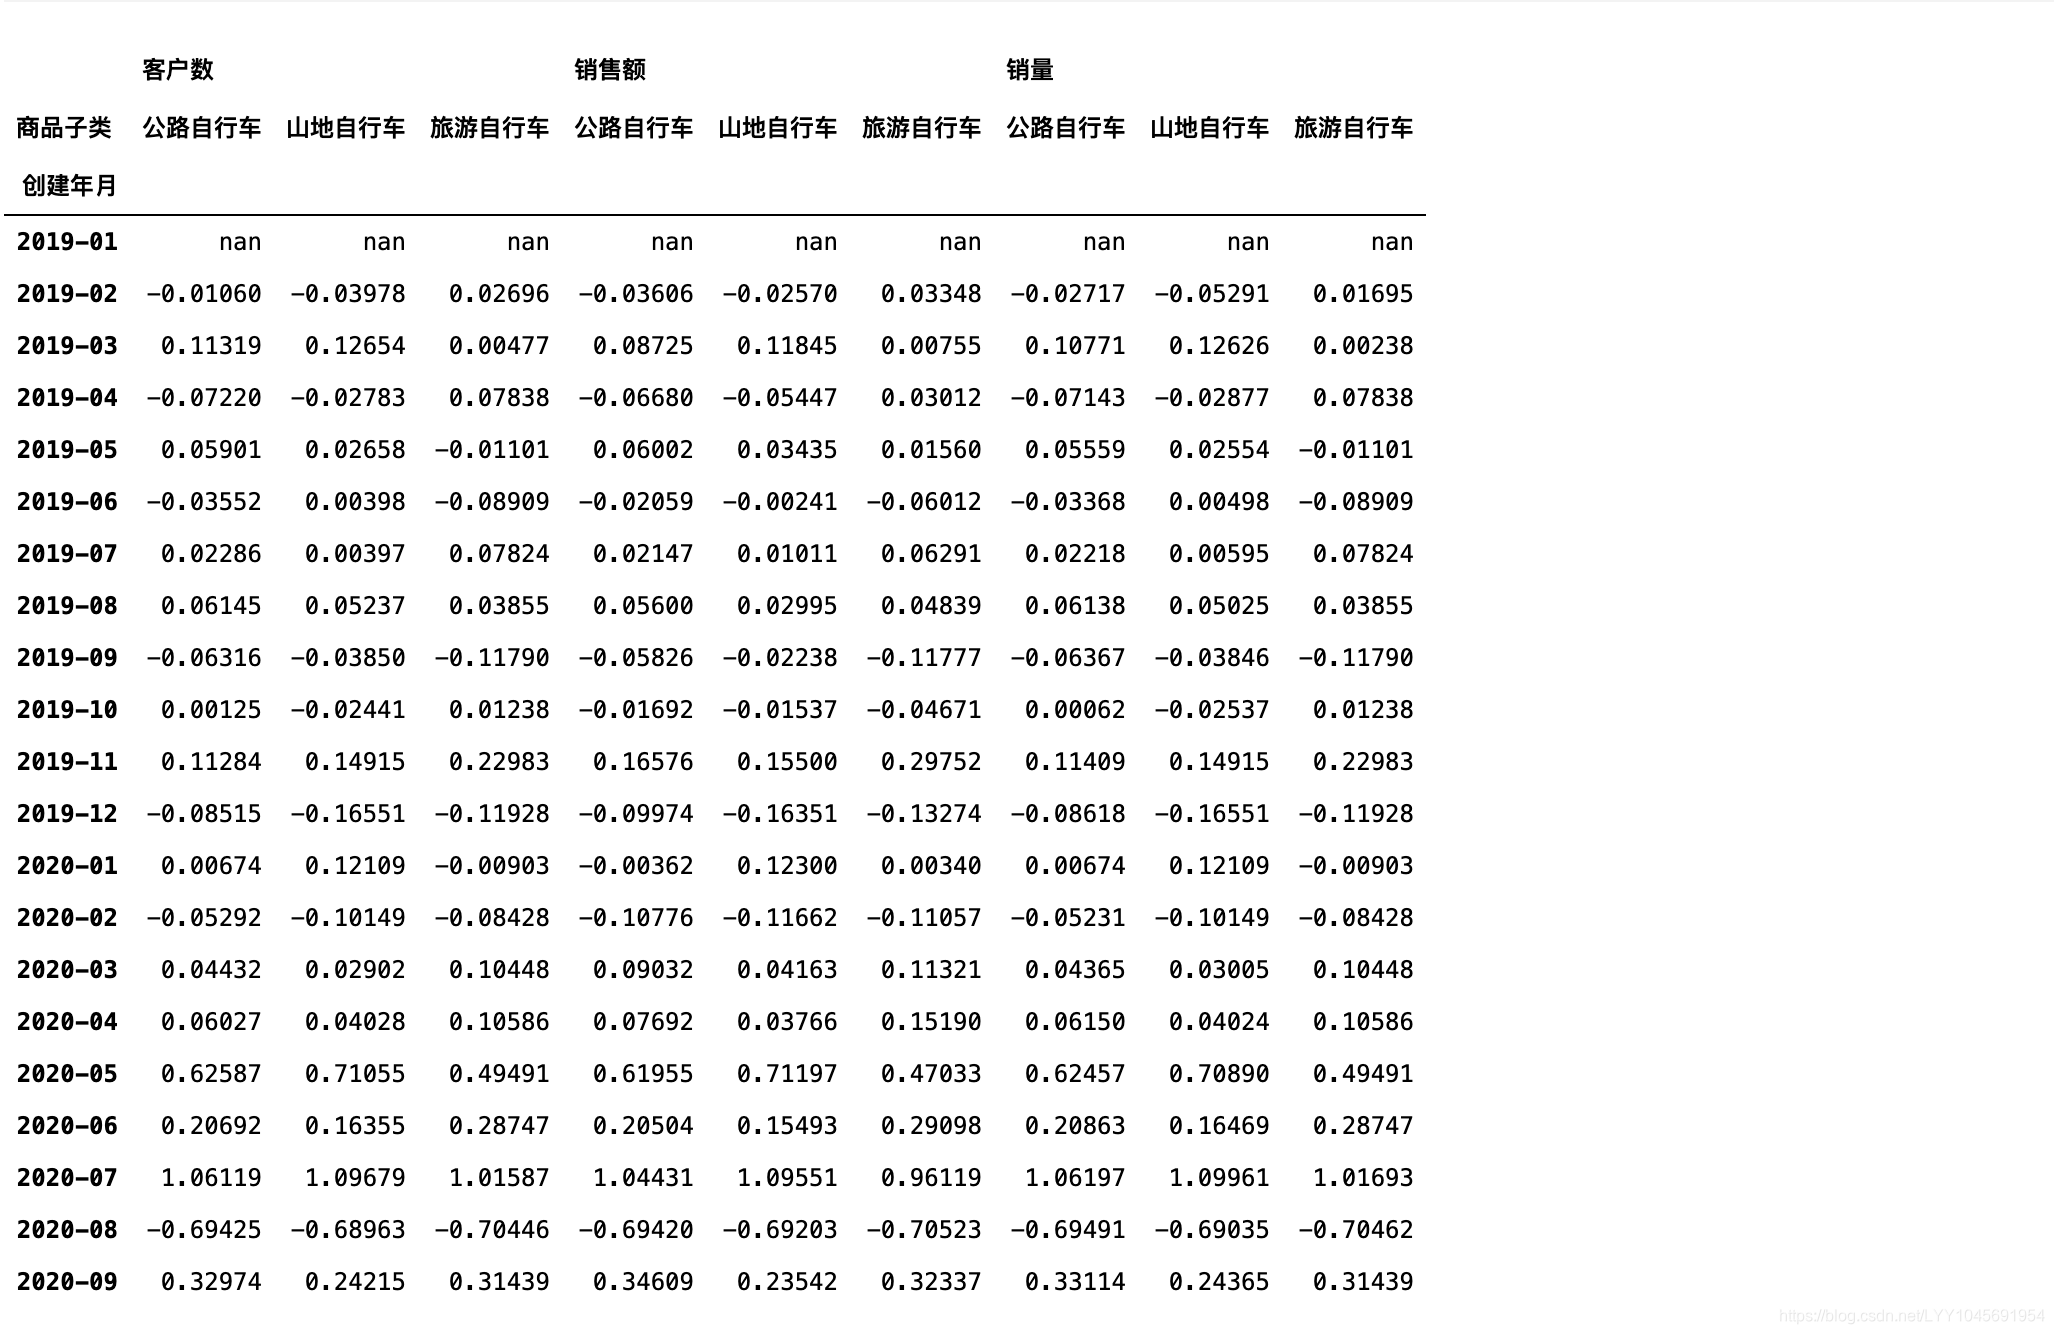
由上图可以看到pivot_table()后创建了多层列引索,
#代码查看列引索:
category_diff.columns'''
MultiIndex([('客户数', '公路自行车'),('客户数', '山地自行车'),('客户数', '旅游自行车'),('销售额', '公路自行车'),('销售额', '山地自行车'),('销售额', '旅游自行车'),( '销量', '公路自行车'),( '销量', '山地自行车'),( '销量', '旅游自行车')],names=[None, '商品子类'])
'''
stack()进行处理。
stack的英文意思就是“堆叠”。stack()能将dataframe的列变成行。
stack()官方链接
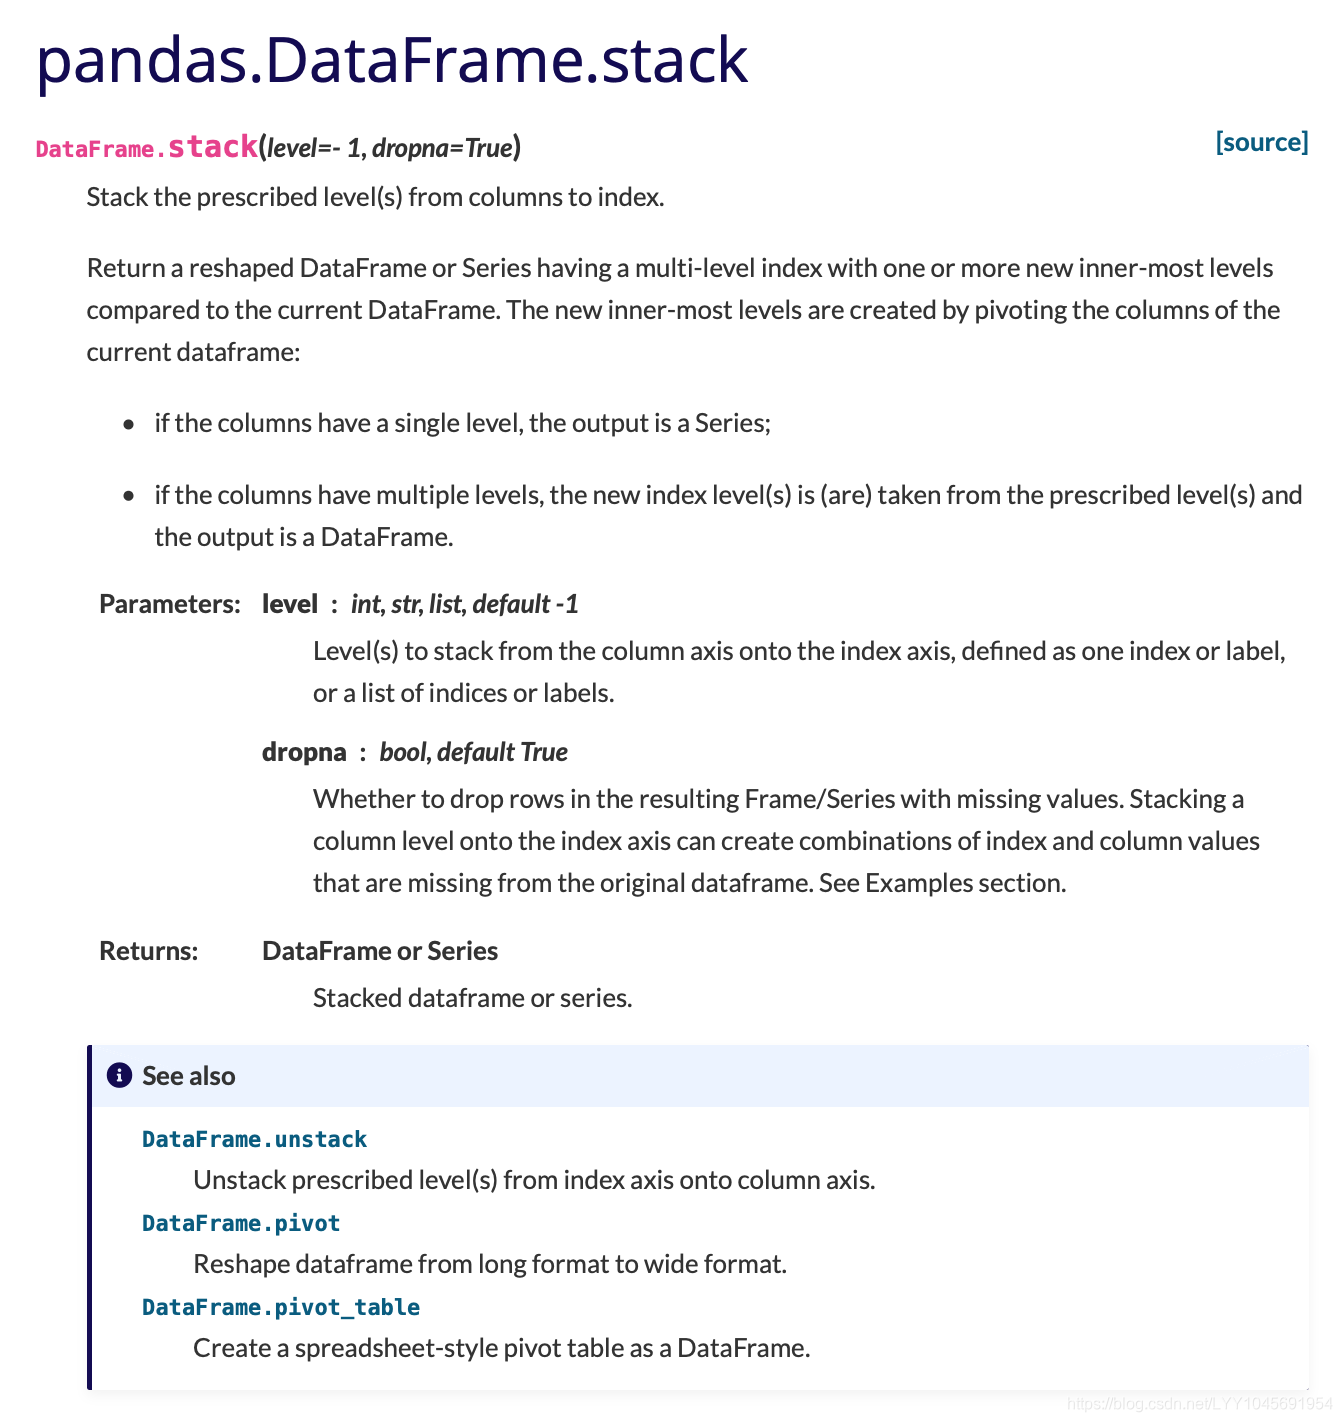
#把子类从列转成行
category_diff=category_diff.stack()
category_diff
此时变成多层行索引
#代码查看行引索:
category_diff.index
'''
MultiIndex([('2019-02', '公路自行车'),('2019-02', '山地自行车'),('2019-02', '旅游自行车'),('2019-03', '公路自行车'),('2019-03', '山地自行车'),('2019-03', '旅游自行车'),('2019-04', '公路自行车'),('2019-04', '山地自行车'),......('2020-08', '公路自行车'),('2020-08', '山地自行车'),('2020-08', '旅游自行车'),('2020-09', '公路自行车'),('2020-09', '山地自行车'),('2020-09', '旅游自行车')],names=['创建年月', '商品子类'])'''
再用reset_index()去处理
reset_index()给Dataframe的行引索重新排序,把原本的行引索都变成了字段,变成值。
category_diff=category_diff.reset_index()
category_diff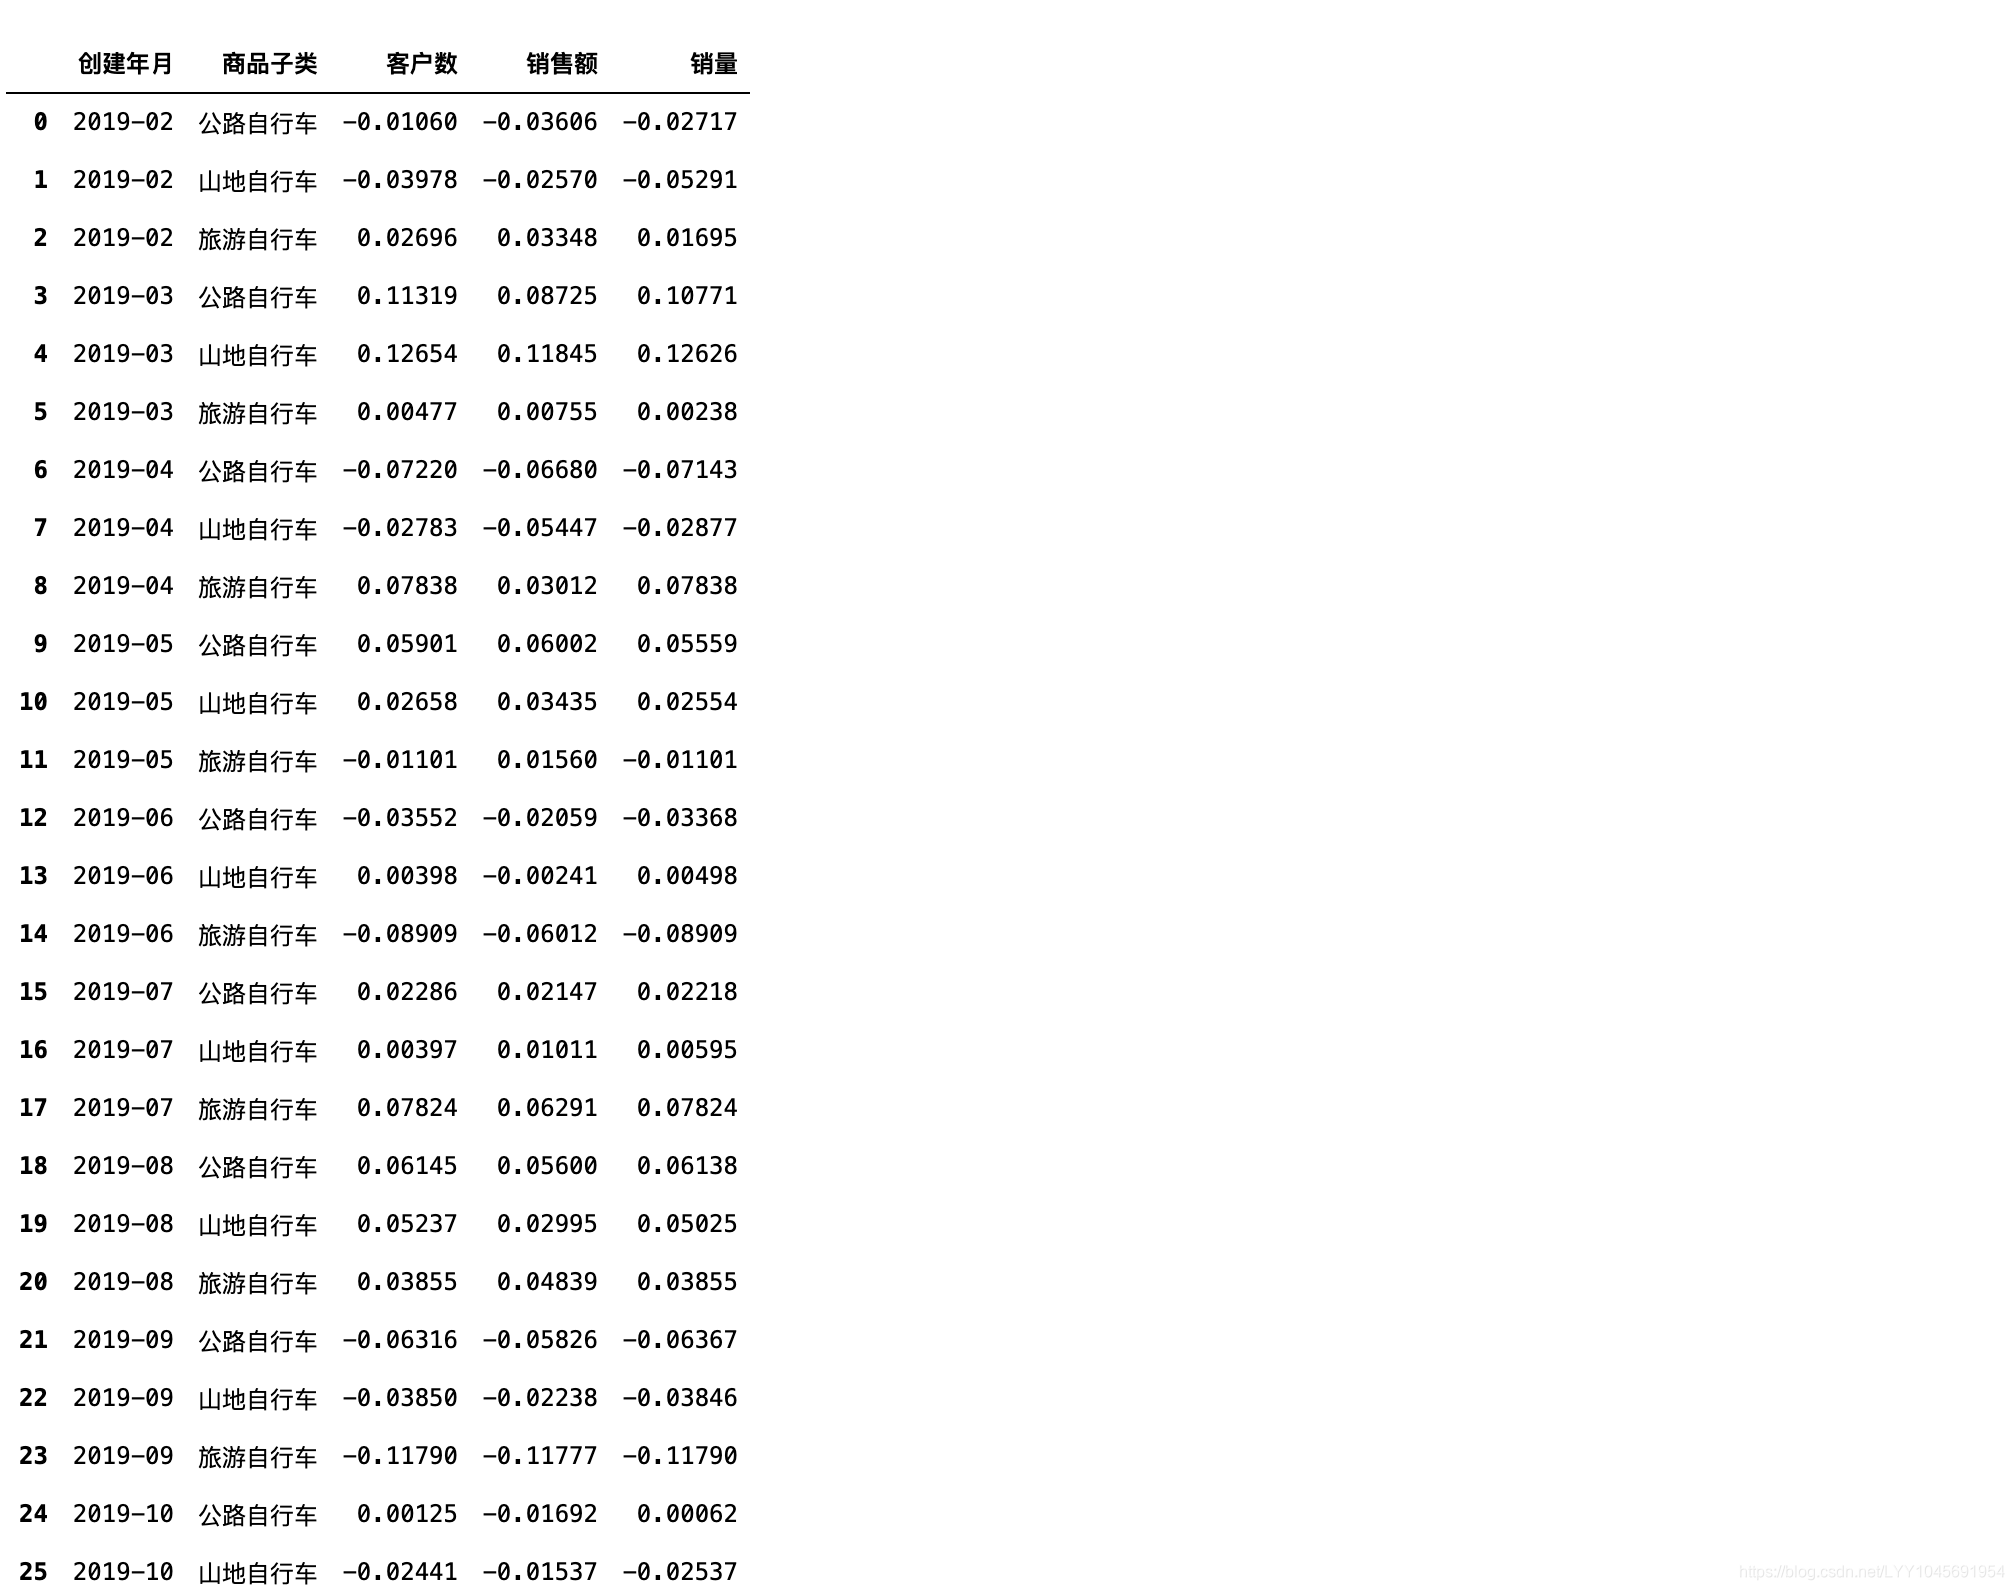
接着rename()字段
rename()改一下字段名,改成指标环比
category_diff=category_diff.rename(columns={"客户数":"客户数环比","销售额":"销售额环比","销量":"销量环比"})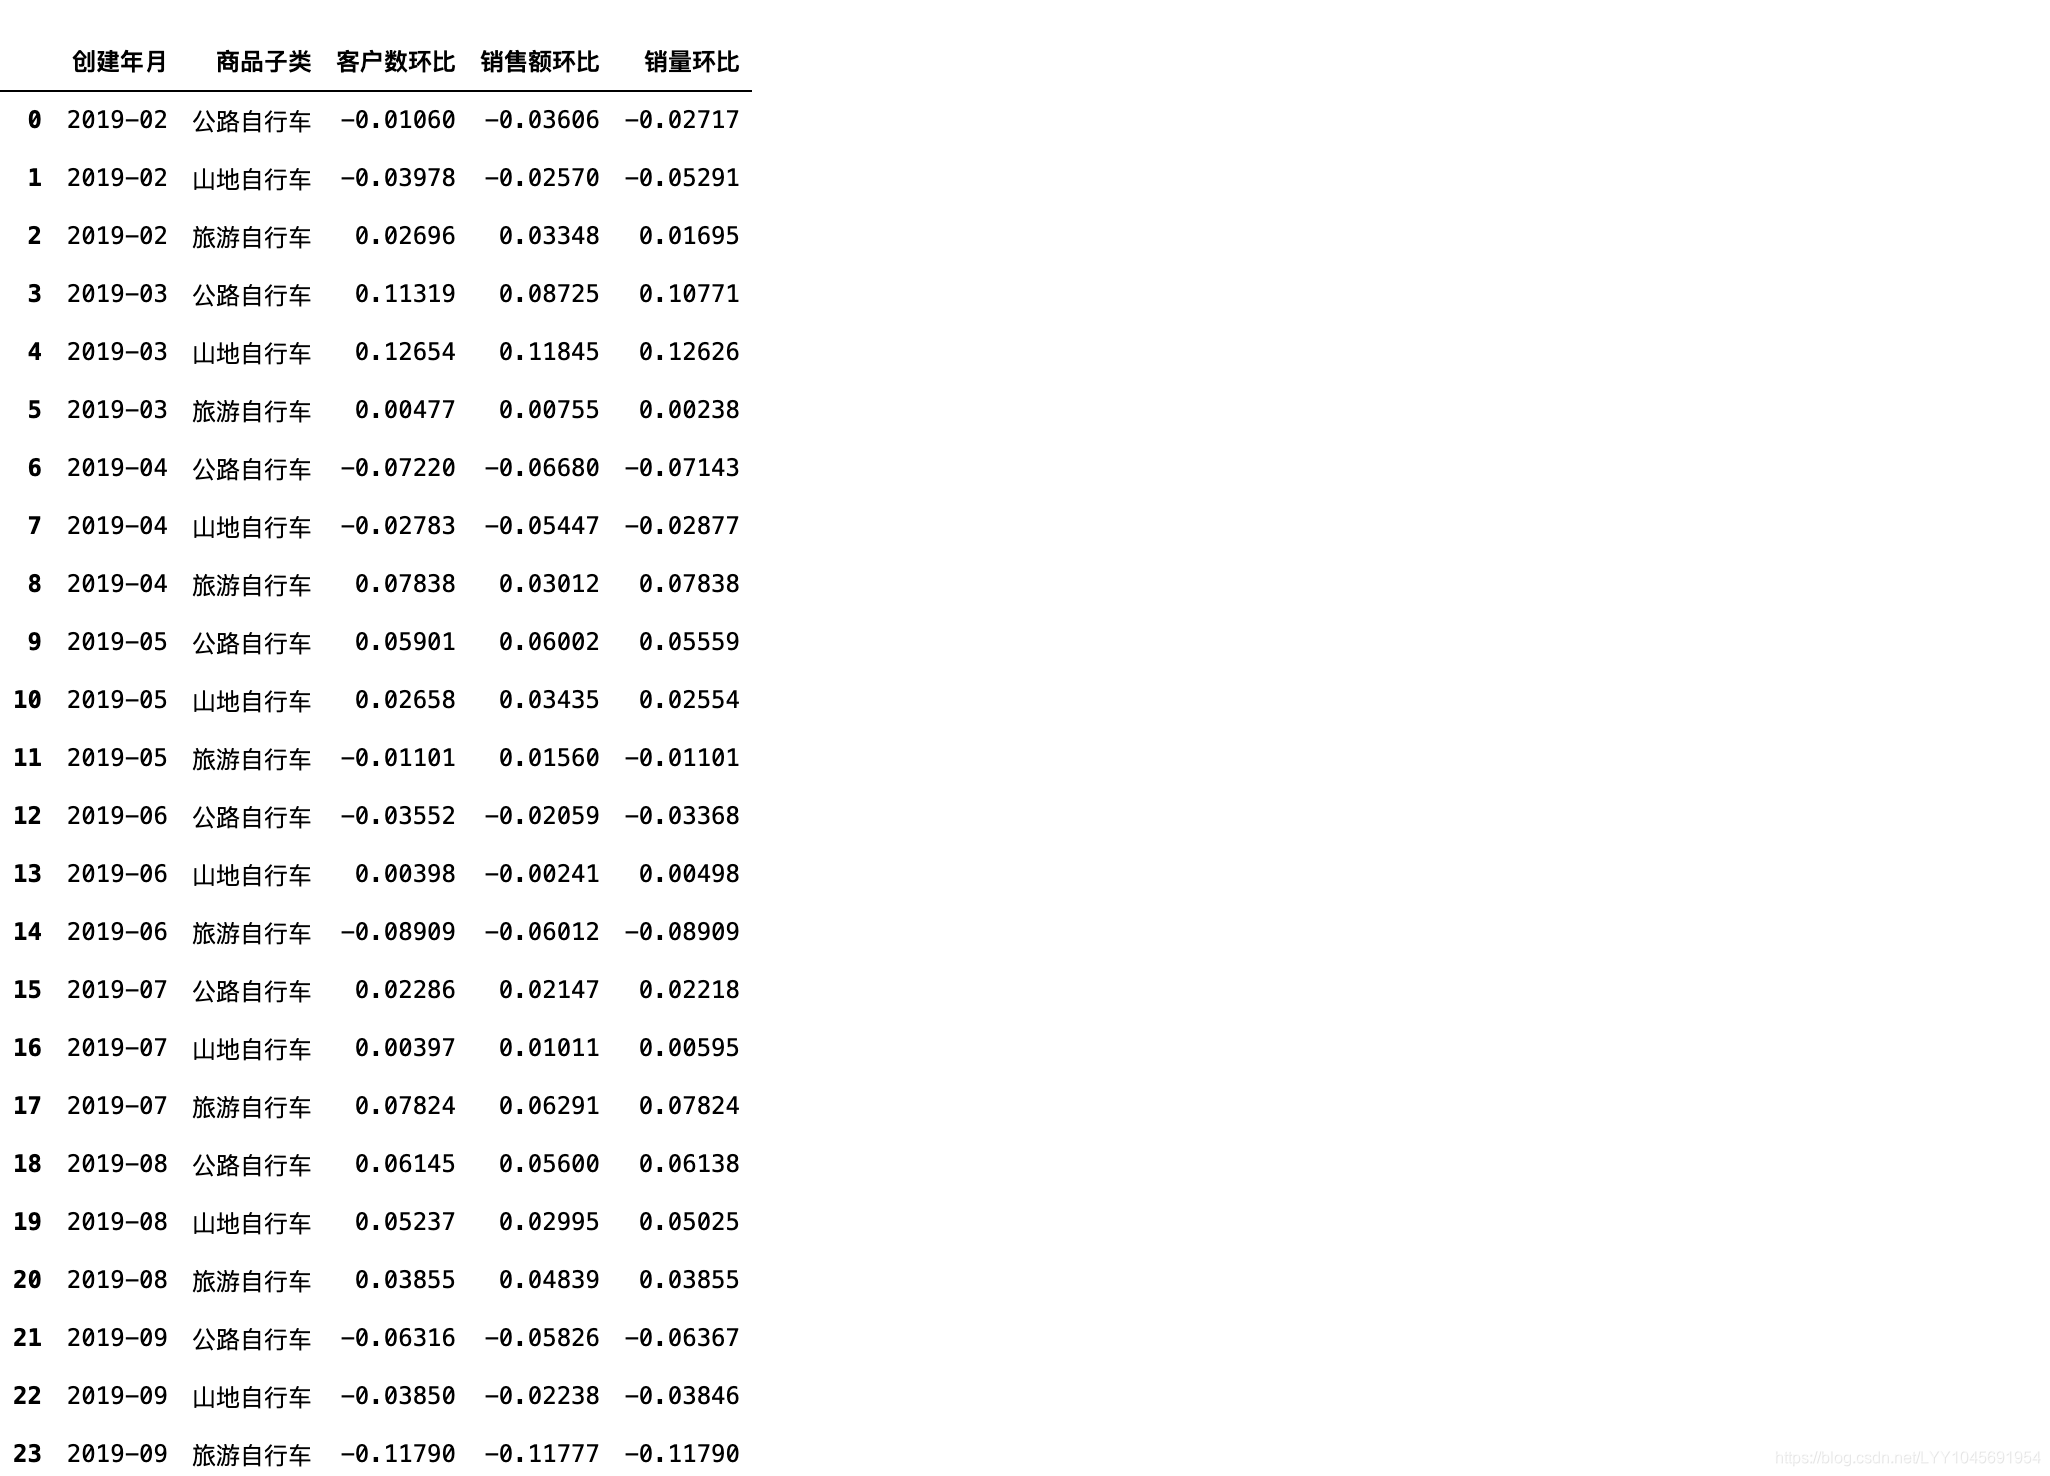
最后merge()组合两个表
product_category=product_category.merge(category_diff,how="left",on=["创建年月","商品子类"])
product_category
计算同比
同比一般情况下是今年第n月与去年第n月比。
同比发展速度主要是为了消除季节变动的影响,用以说明本期发展水平与去年同期发展水平对比而达到的相对发展速度。
举例:
2020年1月销量同比=(2020年1月销量-2019年1月销量)/2019年1月销量
先提取月份:
product_category["月"]=product_category["创建年月"].apply(lambda x:x.split("-")[1])用for loop分两层算同比:
customers_diff=pd.Series([])
orders_diff=pd.Series([])
amount_diff=pd.Series([])for month in month_values:for zi_lei in zi_lei_list:customers_change=pd.Series([])customers_change=product_category[(product_category["月"]==month)&(product_category["商品子类"]==zi_lei)]["客户数"].pct_change()customers_diff=customers_diff.append(customers_change)orders_change=pd.Series([])orders_change=product_category[(product_category["月"]==month)&(product_category["商品子类"]==zi_lei)]["销量"].pct_change()orders_diff=orders_diff.append(orders_change)amount_change=pd.Series([])amount_change=product_category[(product_category["月"]==month)&(product_category["商品子类"]==zi_lei)]["销售额"].pct_change()amount_diff=amount_diff.append(amount_change)product_category["客户数同比"]=customers_diff
product_category["订单数同比"]=orders_diff
product_category["总价同比"]=amount_diff
product_category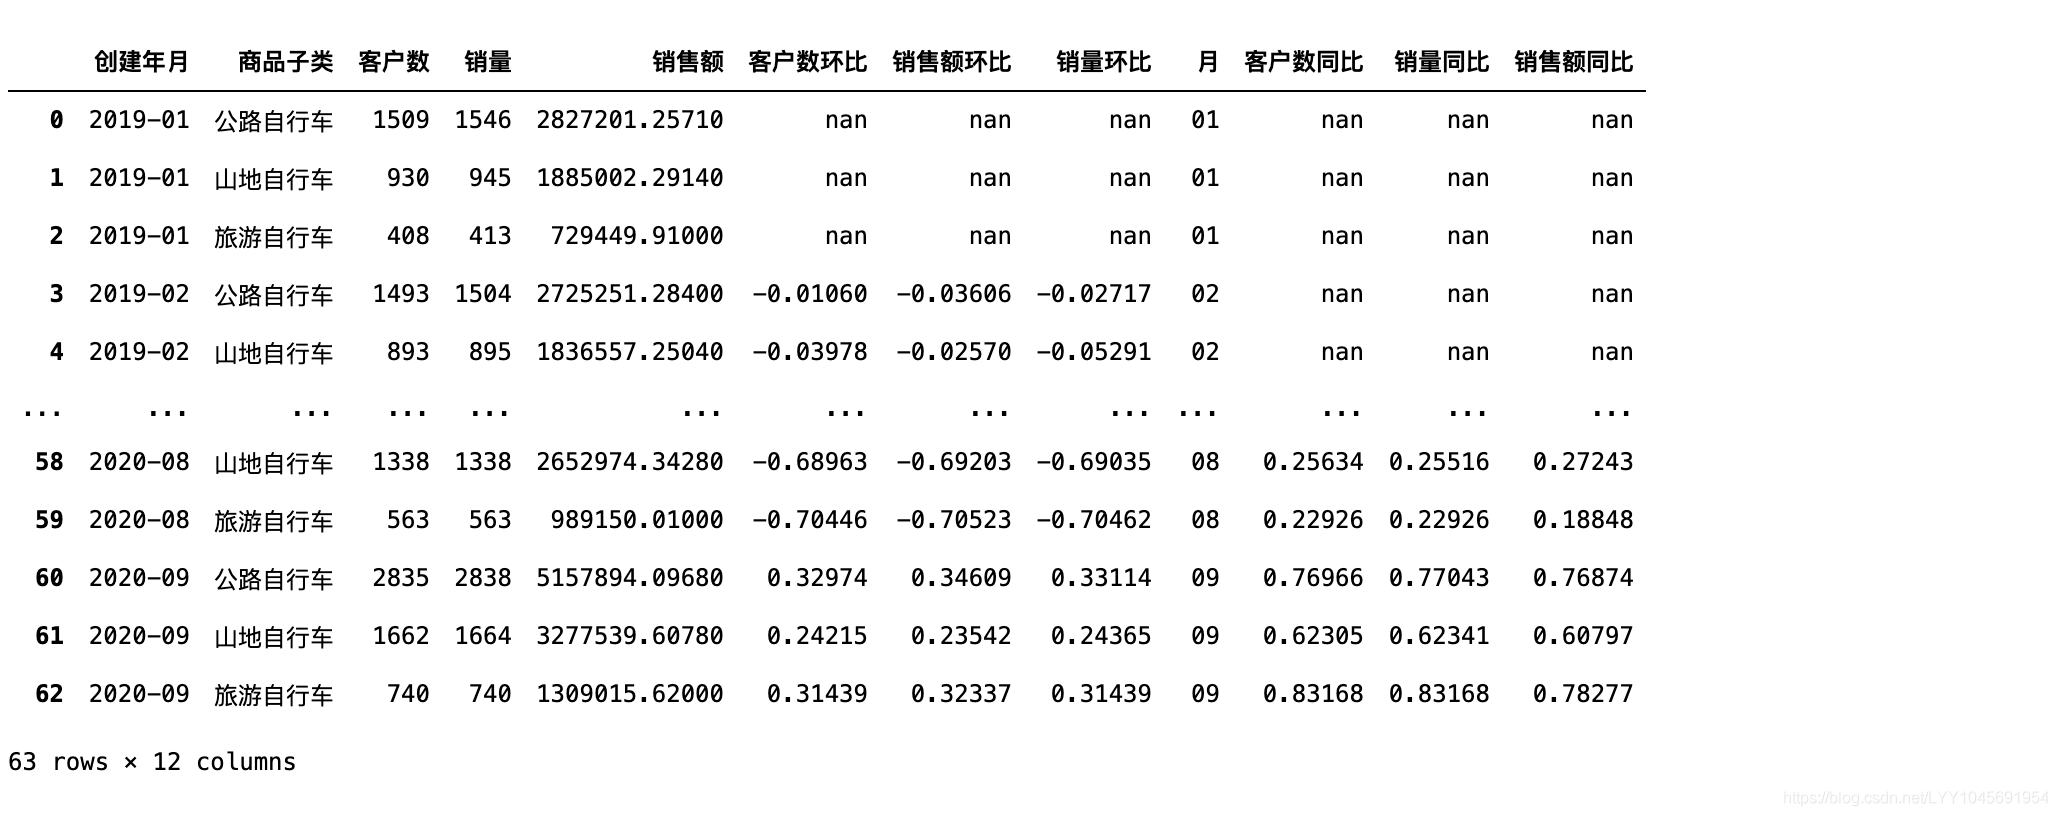
再举一个例子,算每个代理商的销售表现,即每个月的客户数、销量、销售额以及对应的环比、同比。
df["代理商"].value_counts()
'''
天逸      38774
悦扬      22697
爱动体育    21814
Name: 代理商, dtype: int64
'''
整体
dist_performent=df.groupby(["创建年月","代理商"]).agg({"客户ID":pd.Series.nunique,"订单ID":"count","价格":"sum"}).reset_index()
dist_performent=dist_performent.rename(columns={"客户ID":"客户数","订单ID":"销量","价格":"销售额"})
dist_performent
环比
dist_performent_diff=dist_performent.pivot_table(index=["创建年月"],columns=["代理商"],values=["客户数","销量","销售额"])
dist_performent_diff=dist_performent_diff.pct_change().stack().reset_index().rename(columns={"客户数":"客户数环比","销售额":"销售额环比","销量":"销量环比"})
dist_performent=dist_performent.merge(dist_performent_diff,how="left",on=["创建年月","代理商"])
dist_performent
同比
dist_performent["月"]=dist_performent["创建年月"].apply(lambda x:x.split("-")[1])
month_values=dist_performent["月"].unique().tolist()
dist_list=dist_performent["代理商"].unique().tolist()customers_diff=pd.Series([])
orders_diff=pd.Series([])
amount_diff=pd.Series([])for month in month_values:for dist in dist_list:customers_change=pd.Series([])customers_change=dist_performent[(dist_performent["月"]==month)&(dist_performent["代理商"]==dist)]["客户数"].pct_change()customers_diff=customers_diff.append(customers_change)orders_change=pd.Series([])orders_change=dist_performent[(dist_performent["月"]==month)&(dist_performent["代理商"]==dist)]["销量"].pct_change()orders_diff=orders_diff.append(orders_change)amount_change=pd.Series([])amount_change=dist_performent[(dist_performent["月"]==month)&(dist_performent["代理商"]==dist)]["销售额"].pct_change()amount_diff=amount_diff.append(amount_change)dist_performent["客户数同比"]=customers_diff
dist_performent["销量同比"]=orders_diff
dist_performent["销售额同比"]=amount_diff
dist_performent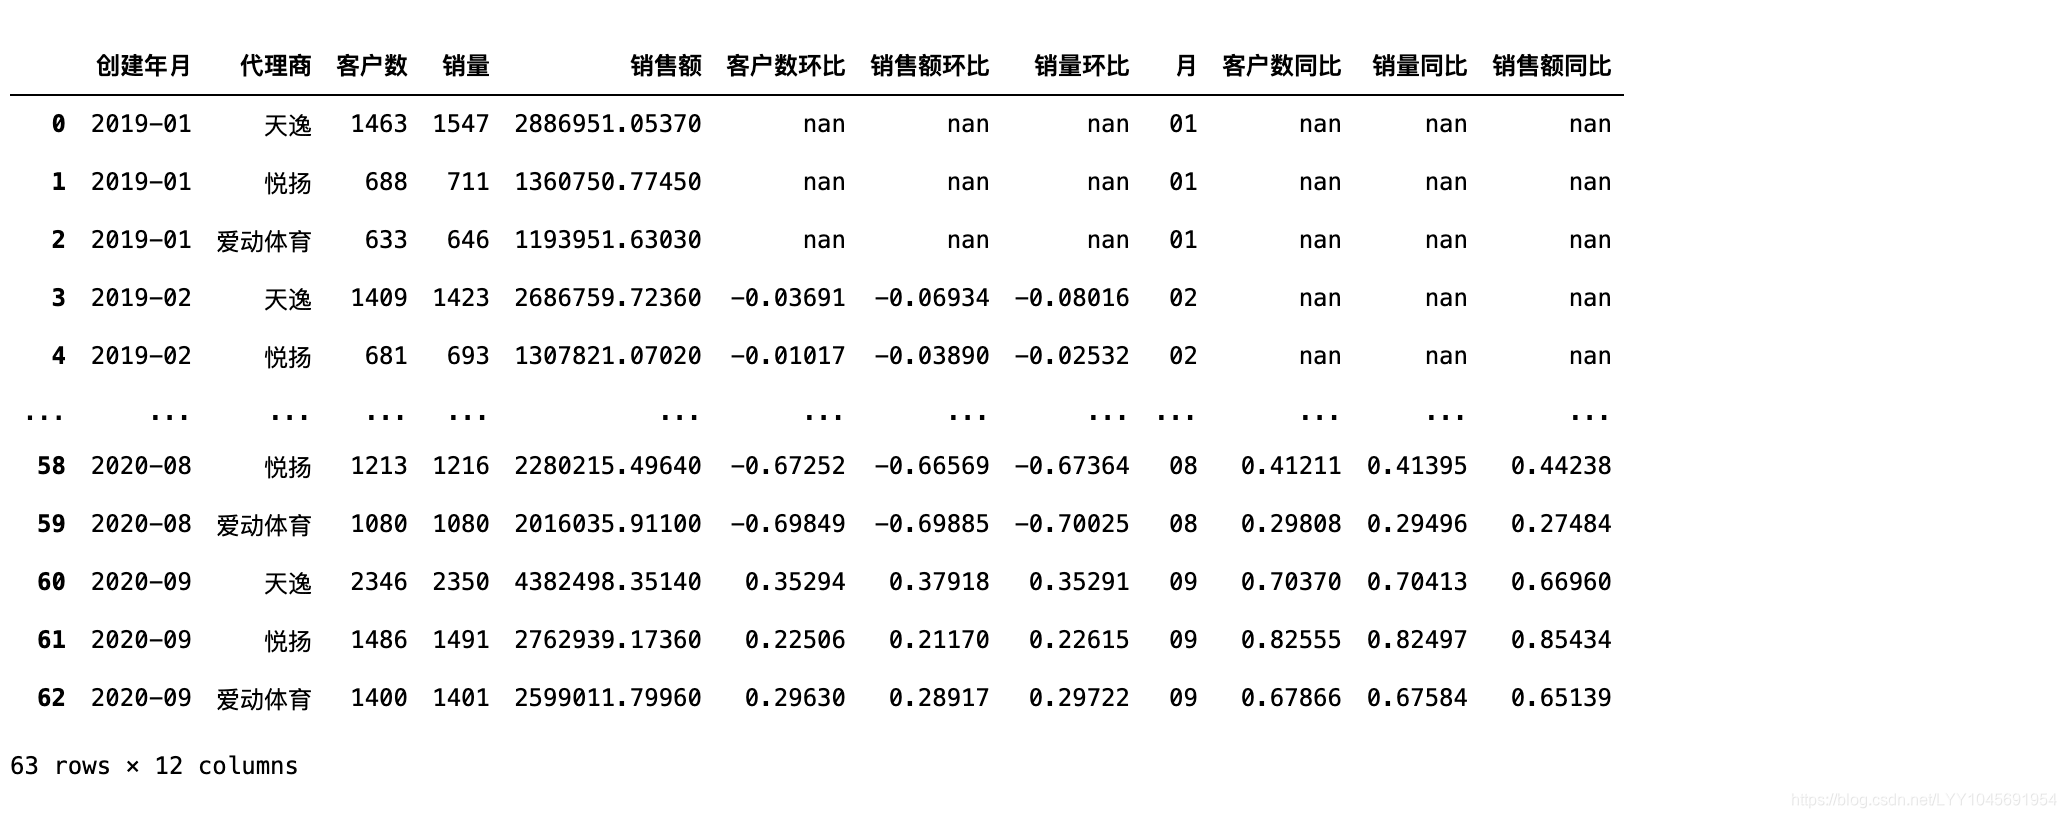
本文来自互联网用户投稿,文章观点仅代表作者本人,不代表本站立场,不承担相关法律责任。如若转载,请注明出处。 如若内容造成侵权/违法违规/事实不符,请点击【内容举报】进行投诉反馈!