Multimodal-intersection-analysis-MIA粗浅的分群
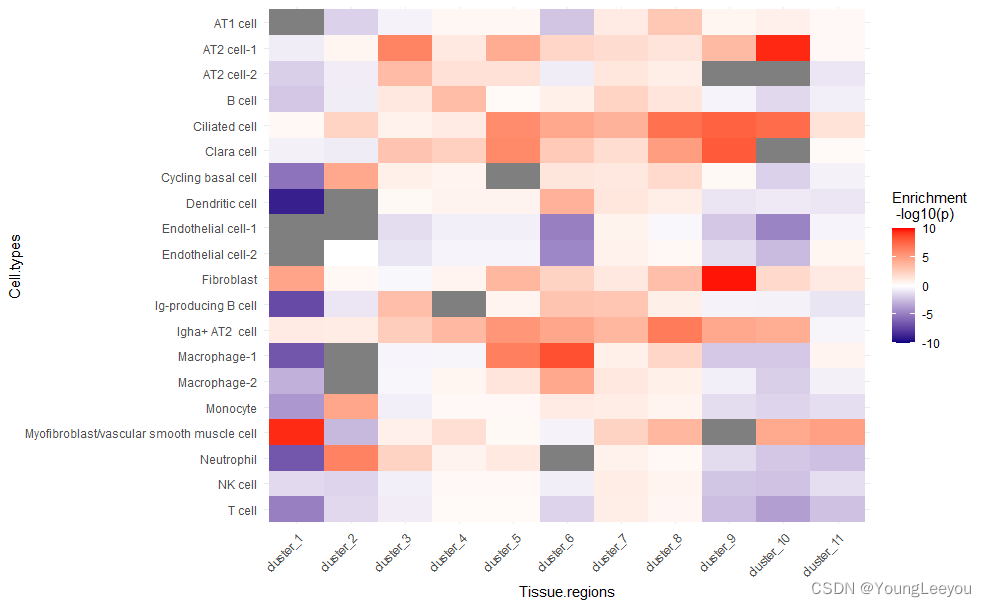
可以看到mia map图上出现了灰色的部分 。这是为什么呢 ??????
因为值超出了(-10,10)的范围,需要加上scaleas包中的函数oob=squish
Visualize as heatmap
library(reshape2)
library(ggplot2)
library(dplyr)
library(Seurat)
library(scales)
heatmap_df <- data.frame('Cell types' = melt(MIA.results)[,1],'Tissue regions' = melt(MIA.results)[,2],enrichment = melt(MIA.results)[,3])
ggplot(data = heatmap_df, aes(x = Tissue.regions, y = Cell.types, fill = enrichment)) +geom_tile() +
scale_fill_gradient2(low = "blue", high = "red",mid = 'white', midpoint = 0, limit = c(-10,10), space = "Lab",oob=squish,name="Enrichment \n -log10(p)") +ylim(heatmap_df$Cell.types %>% levels() %>% sort() %>% rev())+theme_minimal()+RotatedAxis()
得到如下图
# Initialize a dataframe for us to store values in:
st.clusts=paste0("cluster_",seq(1,11,1))
cluster_gene_stat = read.table("G:/silicosis/sicosis/yll/overlapped_clusters_0228/Merged_11_clusters_all_significant_genes.csv", header = TRUE, sep = ",")## 4937 35
head(cluster_gene_stat)
st.marker.list = list()
for(i in 1:11){ #按照p0.05值、flodchange 1标准 获得11个cluster的marker基因 列表st.marker.list[[paste("cluster", i, sep = "_")]] <- cluster_gene_stat[ cluster_gene_stat[, 2+3*i]<0.1 &cluster_gene_stat[,1+3*i]>0.1, "FeatureName"]
}
head(st.marker.list)cellType_gene_stat = openxlsx::read.xlsx("G:/silicosis/sicosis/yll/all_cluster_markers.xlsx", rowNames = TRUE)## 7256 7
head(cellType_gene_stat)
cellType_marker = list()
for(i in unique(cellType_gene_stat$cluster)){ #按照标准 获得20个细胞类型的marker基因 列表cellType_marker[[i]] = cellType_gene_stat[cellType_gene_stat$cluster==i & cellType_gene_stat$p_val_adj<0.1 &cellType_gene_stat$avg_log2FC>0.7, "gene"]
}
cellType_marker
head(cellType_marker)
names(cellType_marker)
sc.marker.list=cellType_marker
sc.clusts=names(cellType_marker)N <- length(st.clusts)
M <- length(sc.clusts)
MIA.results <- matrix(0,nrow = M, ncol = N)
row.names(MIA.results) <- sc.clusts
colnames(MIA.results) <- st.clusts
head(MIA.results)# Gene universe
gene.universe <- length(rownames(cluster_gene_stat))# Loop over ST clusters
for (i in 1:N) {# Then loop over SC clusters#i=1for (j in 1:M) {genes1 <- st.marker.list[[st.clusts[i]]]genes2 <- sc.marker.list[[sc.clusts[j]]]# Hypergeometric A <- length(intersect(genes1,genes2))B <- length(genes1)C <- length(genes2)enr <- -log10(phyper(A, B, gene.universe-B, C, lower.tail = FALSE))dep <- -log10(1-phyper(A, B, gene.universe-B, C, lower.tail = FALSE))if (enr < dep) {MIA.results[j,i] = -dep} else {MIA.results[j,i] = enr}}
}# Some results were -Inf...check why this is the case...
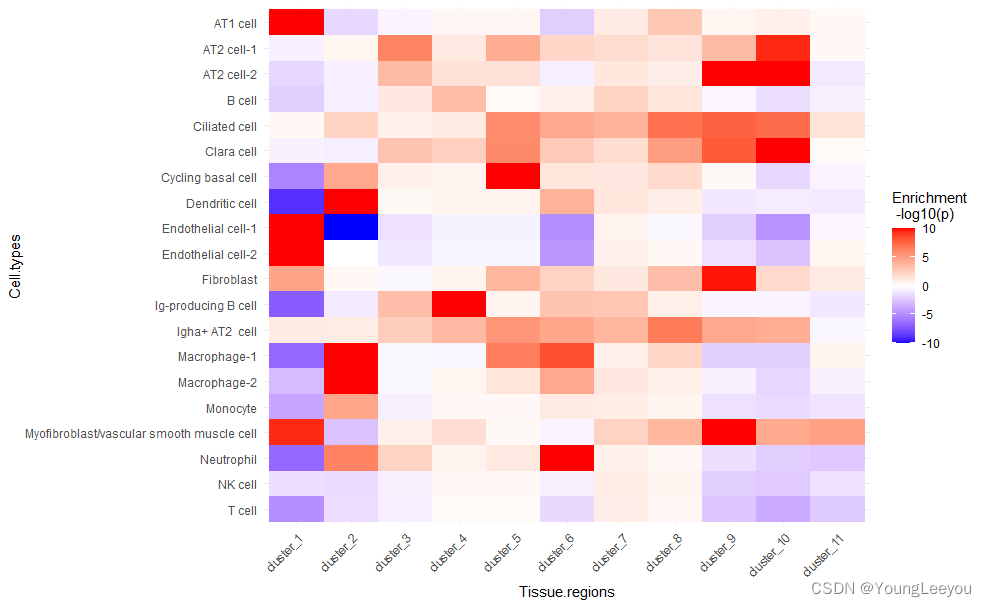
MIA.results[is.infinite(MIA.results)] <- 0# Visualize as heatmap
library(reshape2)
library(ggplot2)
library(dplyr)
library(Seurat)
heatmap_df <- data.frame('Cell types' = melt(MIA.results)[,1],'Tissue regions' = melt(MIA.results)[,2],enrichment = melt(MIA.results)[,3])
ggplot(data = heatmap_df, aes(x = Tissue.regions, y = Cell.types, fill = enrichment)) +geom_tile() +
scale_fill_gradient2(low = "navyblue", high = "red", mid = "white", midpoint = 0, limit = c(-10,10), space = "Lab", name="Enrichment \n -log10(p)") +ylim(heatmap_df$Cell.types %>% levels() %>% sort() %>% rev())+theme_minimal()+RotatedAxis() 本文来自互联网用户投稿,文章观点仅代表作者本人,不代表本站立场,不承担相关法律责任。如若转载,请注明出处。 如若内容造成侵权/违法违规/事实不符,请点击【内容举报】进行投诉反馈!