Matplotlib绘制简单动图
之前写过一篇关于绘制雨点动图的博客
Python/Matplotlib实现雨点图动画
博客中使用了matplotlib的animation模块,使用比较繁琐,下面介绍一种比较简单的办法,使用交互式绘图和暂停功能实现,直接看下面代码:
import numpy as np
import matplotlib.pyplot as plt
from matplotlib import font_manager
# 解决中文乱码问题
myfont = font_manager.FontProperties(fname=r"C:\Windows\Fonts\msyh.ttc"
, size=14)
N = 20
plt.close() # 关闭打开的图形窗口
def anni():fig = plt.figure()plt.ion() # 打开交互式绘图interactivefor i in range(N):plt.cla()           # 清除原有图像plt.xlim(-0.2,20.4) # 设置x轴坐标范围plt.ylim(-1.2,1.2)  # 设置y轴坐标范围# 每当i增加的时候,增加自变量x的区间长度,可以理解为不断叠加绘图,所以每次循环之前都使用plt.cla()命令清除原有图像x = np.linspace(0,i+1,1000) y = np.sin(x)plt.plot(x,y)plt.pause(0.1)# plt.ioff() #关闭交互式绘图plt.show()anni()
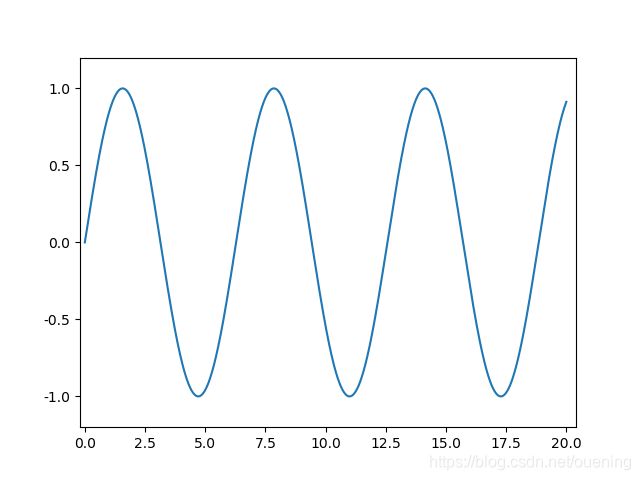
运行代码后就能看到动图效果了
使用annimation模块的方法如下:
import numpy as np
import matplotlib.pyplot as pl
import matplotlib.animation as animationx = np.linspace(0, 10, 100)
y = np.sin(x)fig, ax = plt.subplots()
line, = ax.plot(x, y, color='k')def update(num, x, y, line):line.set_data(x[:num], y[:num])line.axes.axis([0, 10, -1, 1])return line,ani = animation.FuncAnimation(fig, update, len(x), fargs=[x, y, line],interval=25, blit=False)
# ani.save('test.gif')
plt.show()
2019-10-19补充
其实使用animation.FuncAnimation 的自主可控性会比较强,适合已知数据的情况,对于像可视化升级网络训练误差这种操作就使用交互式绘图比较方便(设置一个列表,每训练完一轮将loss追加至该列表,然后再打印出来),这里补充再补充一个animation.FuncAnimation的用法,类似matlab的彗星图,代码如下:
import matplotlib.animation as animation
import matplotlib.pyplot as plt
#指定ffmpeg.exe的位置
plt.rcParams['animation.ffmpeg_path']=r"E:\Applications\ffmpeg-20191018-feaec3b-win64-static\bin\ffmpeg.exe"import numpy as npt = np.linspace(0, 2*np.pi,100)
x = 2*np.sin(2*t)
y = 5*np.cos(3*t)fig = plt.figure(figsize=(8,6.4)) # 建立图像画布
# ax = fig.add_subplot(111,autoscale_on=True)
ax = fig.add_subplot(111,autoscale_on=True,\
xlim=(-np.max(x)-np.max(x)/8,np.max(x)+np.max(x)/8),ylim=(-np.max(y)-np.max(y)/8,np.max(y)+np.max(y)/8))
ax.set_xlabel('position')# 设置小球
ball, = ax.plot([],[],linestyle='None',marker='o',\markersize=10,markeredgecolor='k',\color='orange',markeredgewidth=2)
line, = ax.plot([],[],linestyle='--',color='blue')def init():'''初始化设置'''ball.set_data(x[0],y[0])line.set_data(x[0],y[0])return ball,linedef animate(i):ball.set_data([x[i]],[y[i]])line.set_data([x[:i]],[y[:i]])return ball,lineani_a = animation.FuncAnimation(fig, animate, \np.arange(1,len(t)), \interval=30,blit=False,init_func=init)ani_a.save('Circle_Animation.mp4',fps=30)plt.show()
效果如下:
CSDN只能上传小于5M的图片资源,前面代码生成的是MP4
格式文件,这里笔者通过ffmpeg将其转化为了gif格式文件,转化命令很简单:
ffmpeg.exe -i Circle_Animation.mp4 Circle_Animation.gif
输出大小是满足要求的,不需要其他参数控制输出结果,ffmpeg很强大,感兴趣的读者可以自行搜索,这里就不多说了。
参考链接
[1]https://zhuanlan.zhihu.com/p/31323002
[2]https://stackoverflow.com/questions/28074461/animating-growing-line-plot-in-python-matplotlib
[3]https://matplotlib.org/api/_as_gen/matplotlib.animation.FuncAnimation.html#matplotlib.animation.FuncAnimation
本文来自互联网用户投稿,文章观点仅代表作者本人,不代表本站立场,不承担相关法律责任。如若转载,请注明出处。 如若内容造成侵权/违法违规/事实不符,请点击【内容举报】进行投诉反馈!