matlab求矩阵的方程组,MATLAB利用矩阵求线性方程组和多项式
https://jingyan.baidu.com/article/ce09321b96d2212bff858fad.html
MATLAB利用矩阵求线性方程组
https://www.yiibai.com/matlab/matlab_polynomials.html
易百教程Matlab多项式。
https://ww2.mathworks.cn/help/matlab/ref/categorical.html
mathwork官方文档
MATLAB表示多项式为包含由下降幂排列的系数的行向量。 例如,方程式
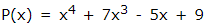
可以表示为 -
p = [1 7 0 -5 9];
评估计算多项式
多值函数用于评估计算指定值的多项式。 例如,要评估前面的多项式p,在x = 4,可使用以下代码 -
p = [1 7 0 -5 9];
polyval(p,4)
MATLAB执行上述语句返回以下结果 -
ans = 693
Shell
MATLAB还提供polyvalm函数用于评估矩阵多项式。 矩阵多项式是以矩阵为变量的多项式。
例如,下面创建一个方阵X并评估求值多项式p,在X -
p = [1 7 0 -5 9];
X = [1 2 -3 4; 2 -5 6 3; 3 1 0 2; 5 -7 3 8];
polyvalm(p, X)
MATLAB
MATLAB执行上述代码语句返回以下结果 -
ans =
2307 -1769 -939 4499
2314 -2376 -249 4695
2256 -1892 -549 4310
4570 -4532 -1062 9269
Shell
计算多项式的根
roots函数计算多项式的根。 例如,要计算多项式p的根,可参考以下语法 -
p = [1 7 0 -5 9];
r = roots(p)
MATLAB
MATLAB执行上述代码语句返回以下结果 -
r =
-6.8661 + 0.0000i
-1.4247 + 0.0000i
0.6454 + 0.7095i
0.6454 - 0.7095i
Shell
poly函数是roots函数的逆,并返回到多项式系数。 例如 -
p = [1 7 0 -5 9];
r = roots(p)
p2 = poly(r)
MATLAB
MATLAB执行上述代码语句返回以下结果 -
Trial>> p = [1 7 0 -5 9];
r = roots(p)
p2 = poly(r)
r =
-6.8661 + 0.0000i
-1.4247 + 0.0000i
0.6454 + 0.7095i
0.6454 - 0.7095i
p2 =
1.0000 7.0000 0.0000 -5.0000 9.0000
Shell
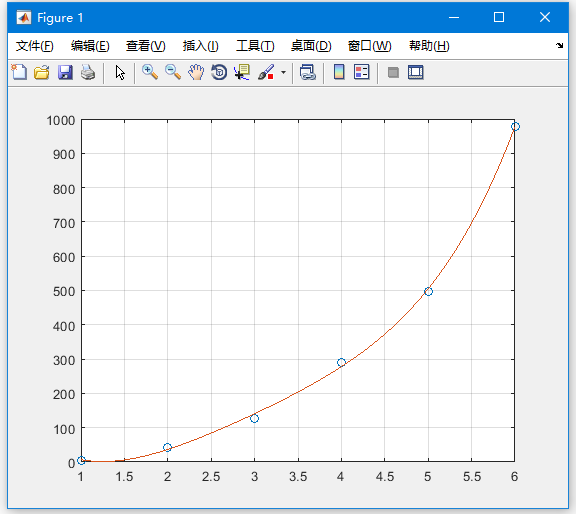
多项式曲线拟合
polyfit函数用来查找一个多项式的系数,它符合最小二乘法中的一组数据。 如果x和y包含要拟合到n度多项式的x和y数据的两个向量,则得到通过拟合数据的多项式,参考代码 -
p = polyfit(x,y,n)
MATLAB
示例
创建脚本文件并键入以下代码 -
x = [1 2 3 4 5 6]; y = [5.5 43.1 128 290.7 498.4 978.67]; %data
p = polyfit(x,y,4) %get the polynomial
% Compute the values of the polyfit estimate over a finer range,
% and plot the estimate over the real data values for comparison:
x2 = 1:.1:6;
y2 = polyval(p,x2);
plot(x,y,'o',x2,y2)
grid on
MATLAB
MATLAB执行上述代码语句返回以下结果 -
Trial>> x = [1 2 3 4 5 6]; y = [5.5 43.1 128 290.7 498.4 978.67]; %data
p = polyfit(x,y,4) %get the polynomial
% Compute the values of the polyfit estimate over a finer range,
% and plot the estimate over the real data values for comparison:
x2 = 1:.1:6;
y2 = polyval(p,x2);
plot(x,y,'o',x2,y2)
grid on
p =
4.1056 -47.9607 222.2598 -362.7453 191.1250
Shell
同时还输出一个图形 -
本文来自互联网用户投稿,文章观点仅代表作者本人,不代表本站立场,不承担相关法律责任。如若转载,请注明出处。 如若内容造成侵权/违法违规/事实不符,请点击【内容举报】进行投诉反馈!