promethuse告警
- 一、定义
- 二、告警功能:
- 三、部署告警对接邮箱
- 四、告警部署
- 五、pro部署
一、定义
Prometheus对指标的收集、存储同告警能力分属于Prometheus Server和AlertManager(通用的组件)两个独立的组件,前者仅负责基于"告警规则"生成告警通知,具体的告警操作则由后者完成;
Alertmanager负责处理由客户端发来的告警通知客户端通常是Prometheus server,但它也支持接收来自其它工具的告警;
Alertmanager对告警通知进行分组、去重后,根据路由规则将其路由到不同的receiver,如Email、短信或PagerDuty等;
目前Alertmanager还不支持钉钉,那用户完全可以通过Webhook与钉钉机器人进行集成,从而通过钉钉接收告警信息。同时AltManager还提供了静默和告警抑制机制来对告警通知行为进行优化
PS:webhook是一个APr概念, webhoo是一种web回调或者http的push APT.Webhook作为一个轻量的事件处理应用
是由PromQL编写的布尔值表达式使用>< =与一个常用量值,比如80%进行比较,其返回值为true或false
prometheus-server对抓取到的指标序列与告警规则中做为比较的Prometheus匹配,则会把此样本值抓取过来作比较,若返回值为true则认为指标异常,不能满足false,则为正常值以上表达式为告警规则表达式
比如:筛选一个指标数据cpu使用率<0%系统异常
2.通知告警信息
一旦条件表达式为true了就会触发通知信息,送给altermanager,由alter借助特定服务的API或者访问入口,将此信息发出去一般称为告警媒介,也可以借助邮件进行告警SMTP
3.prometheus监控系统的告警逻辑
route:告警路由,分组、分类分发告警消息给不同渠道
prometheus通过alter-rule规则,生成告警通知给altermanager
altermanager会生成本地的告警路由表(第一路由默认称为根路由,所有的告警信息都需要一个根路由,没有一个匹配项,则需要设置一个默认路由)为实现将特定的信息发送给特定的用户
例如:
按消息级别来看,严重、中等、普通级别,红色报警、蓝色报警,应用发送方
按分组:业务运维、系统运维、基础设施运维、k8s运维
二、告警功能:
除了基本的告警通知能力外,Altermanager还支持对告警进行去重、分组、抑制、静默、抑制等功能;
分组 (Grouping):将相似告警合并为单个告警通知的机制,在系统因大面积故障而触发告警潮时,分组机制能避免用户被大量的告警噪声淹没,进而导致关键信息的隐没;
抑制(Inhibition):系统中某个组件或服务故障而触发告警通知后,那些依赖于该组件或服务的其它组件或服务可能也会因此而触发告警,抑制便是避免类似的级联告警的一种特性,从而让用户能将精力集中于真正的故障所在;
静默(silent):是指在一个特定的时间窗口内,即便接收到告警通知,Alertmanager也不会真正向用户发送告警信息的行为;通常,在系统例行维护期间,需要激活告警系统的静默特性;
路由(route):用于配置Alertmanager如何处理传入的特定类型的告警通知,其基本逻辑是根据路由匹配规则的匹配结果来确定处理当前告警通知的路径和行为
三、部署告警对接邮箱
首先准备对接的邮箱
选用的是QQ邮箱
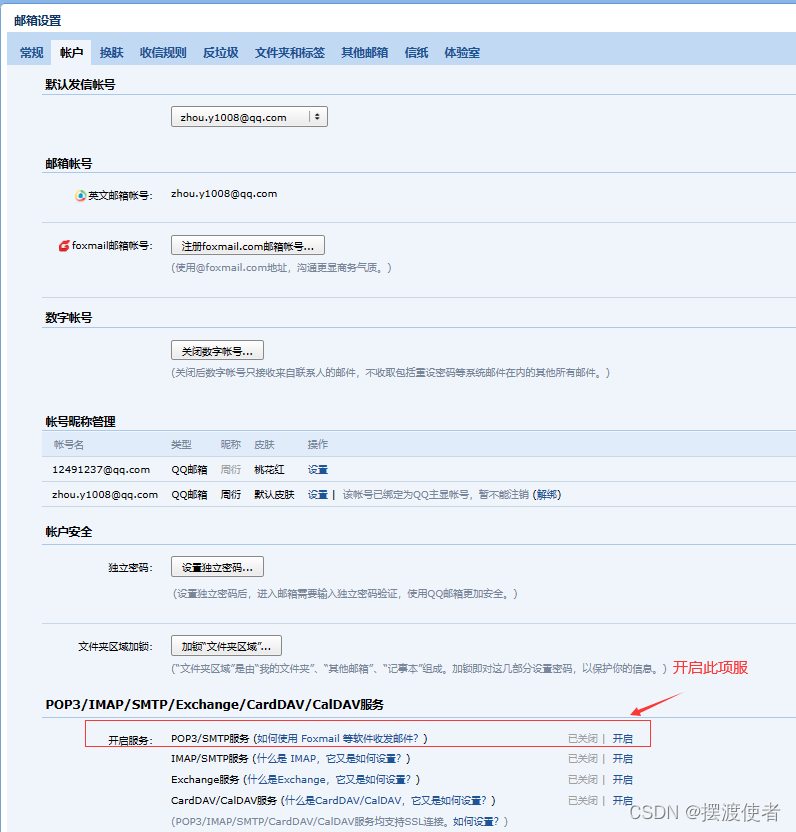
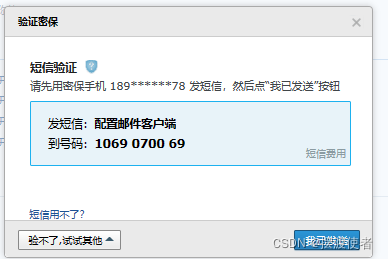
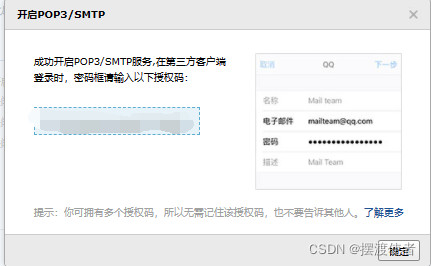
按要求发送短信进行验证,这样就可以得到授权码了
四、告警部署
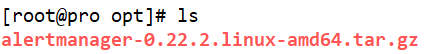
[root@pro opt]# tar zxf alertmanager-0.22.2.linux-amd64.tar.gz -C /usr/local/
[root@pro opt]# cat /usr/local/alertmanager/alertmanager.ymlglobal:													#全局参数resolve_timeout: 5mroute:													#路由信息group_by: ['alertname']								#分组group_wait: 30s		 								#分组缓冲/等待时间group_interval: 5m	 								#重新分组时间repeat_interval: 1h	 								#重新告警间隔receiver: 'web.hook'	 								#接收方/媒介
receivers:
- name: 'web.hook'webhook_configs:- url: 'http://127.0.0.1:5001/'						#标注5001端口
inhibit_rules:											#抑制规则的策略- source_match:										#匹配项severity: 'critical'								#严重的级别target_match:severity: 'warning'								#target匹配warning级别equal: ['alertname', 'dev', 'instance']				#符合alertname、dev、instance
修改配置
[root@pro opt]# vim /usr/local/alertmanager/alertmanager.yml
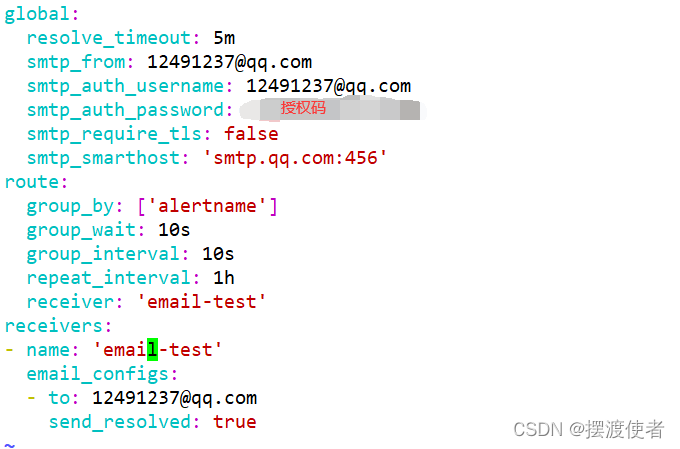
global:resolve_timeout: 5msmtp_from: 12491237@qq.comsmtp_auth_username: 12491237@qq.comsmtp_auth_password: 授权码smtp_require_tls: falsesmtp_smarthost: 'smtp.qq.com:456'
route:group_by: ['alertname']group_wait: 10sgroup_interval: 10srepeat_interval: 1hreceiver: 'email-test'
receivers:
- name: 'email-test'email_configs:- to: 12491237@qq.comsend_resolved: true
[root@pro opt]# cd /usr/local/alertmanager
[root@pro alertmanager]# ./alertmanager
五、pro部署
[root@pro prometheus-2.27.1.linux-amd64]# mkdir alert_config
[root@pro prometheus-2.27.1.linux-amd64]# cd alert_config/
[root@pro alert_config]# mkdir alert_rules targets
[root@pro alert_config]# ls
alert_rules  targets
[root@pro alert_config]# cd alert_rules/
[root@pro alert_rules]# vim instance_down.yaml
groups:
- name: AllInstancesrules:- alert: InstanceDown         #节点服务挂掉 # Condition for alertingexpr: up == 0                 #up状态为0时for: 1m# Annotation - additional informational labels to store more informationannotations:title: 'Instance down'description: Instance has been down for more than 1 minute.'# Labels - additional labels to be attached to the alertlabels:severity: 'critical'            #告警级别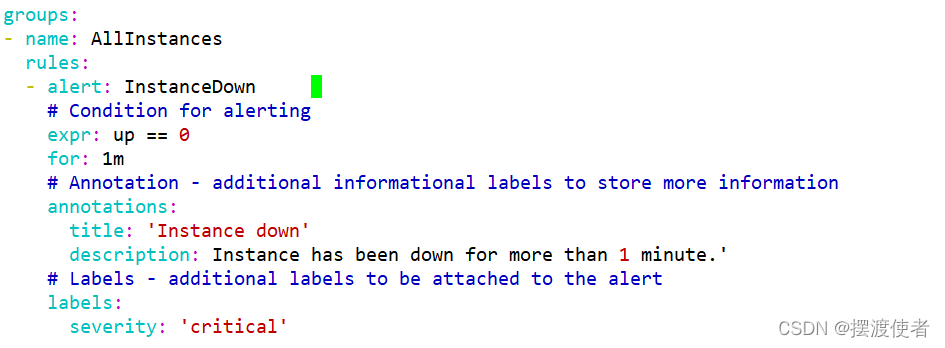
[root@pro alert_rules]# cd ..
[root@pro alert_config]# cd targets/
[root@pro targets]# vim alertmanagers.yaml
- targets:- 192.168.133.50:9093labels:app: alertmanager

[root@pro targets]# vim nodes-linux.yaml
- targets:- 192.168.133.50:9100- 192.168.133.75:9100- 192.168.133.100:9100labels:app: node-exporterjob: node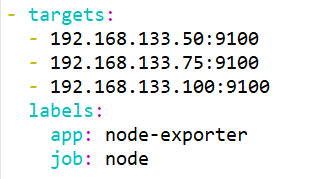
[root@pro targets]# vim prometheus-servers.yaml
- targets:- 192.168.133.50:9090labels:app: prometheusjob: prometheus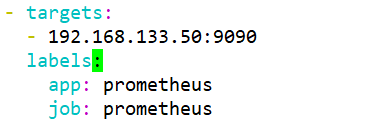
[root@pro prometheus-2.27.1.linux-amd64]# vim /usr/local/alertmanager/alert-config/prometheus.yml
# my global config
# Author: MageEdu
# Repo: http://gitlab.magedu.com/MageEdu/prometheus-configs/
global:scrape_interval:     15s # Set the scrape interval to every 15 seconds. Default is every 1 minute.evaluation_interval: 15s # Evaluate rules every 15 seconds. The default is every 1 minute.# scrape_timeout is set to the global default (10s).# Alertmanager configuration
alerting:alertmanagers:- file_sd_configs:- files:- "targets/alertmanagers*.yaml"# Load rules once and periodically evaluate them according to the global 'evaluation_interval'.
rule_files:- "rules/*.yaml"- "alert_rules/*.yaml"# A scrape configuration containing exactly one endpoint to scrape:
# Here it's Prometheus itself.
scrape_configs:# The job name is added as a label `job=` to any timeseries scraped from this config.- job_name: 'prometheus'# metrics_path defaults to '/metrics'# scheme defaults to 'http'.static_configs:file_sd_configs:- files:- targets/prometheus-*.yamlrefresh_interval: 2m# All nodes- job_name: 'nodes'file_sd_configs:- files:- targets/nodes-*.yamlrefresh_interval: 2m- job_name: 'alertmanagers'file_sd_configs:- files:- targets/alertmanagers*.yamlrefresh_interval: 2m 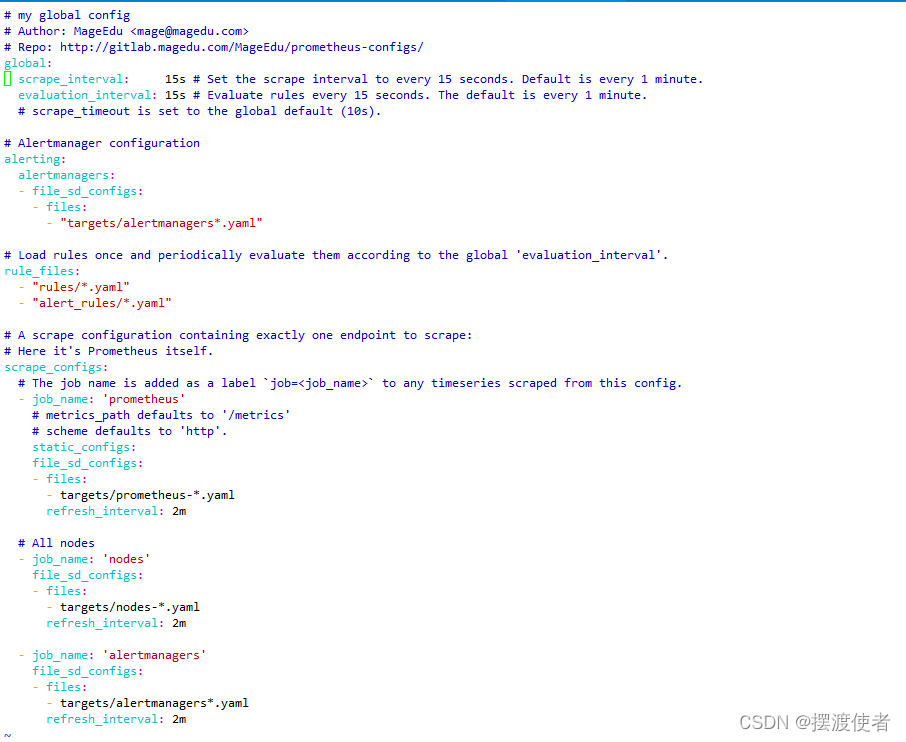
[root@pro prometheus-2.27.1.linux-amd64]# ./prometheus --config.file=./alert_config/prometheus.yml
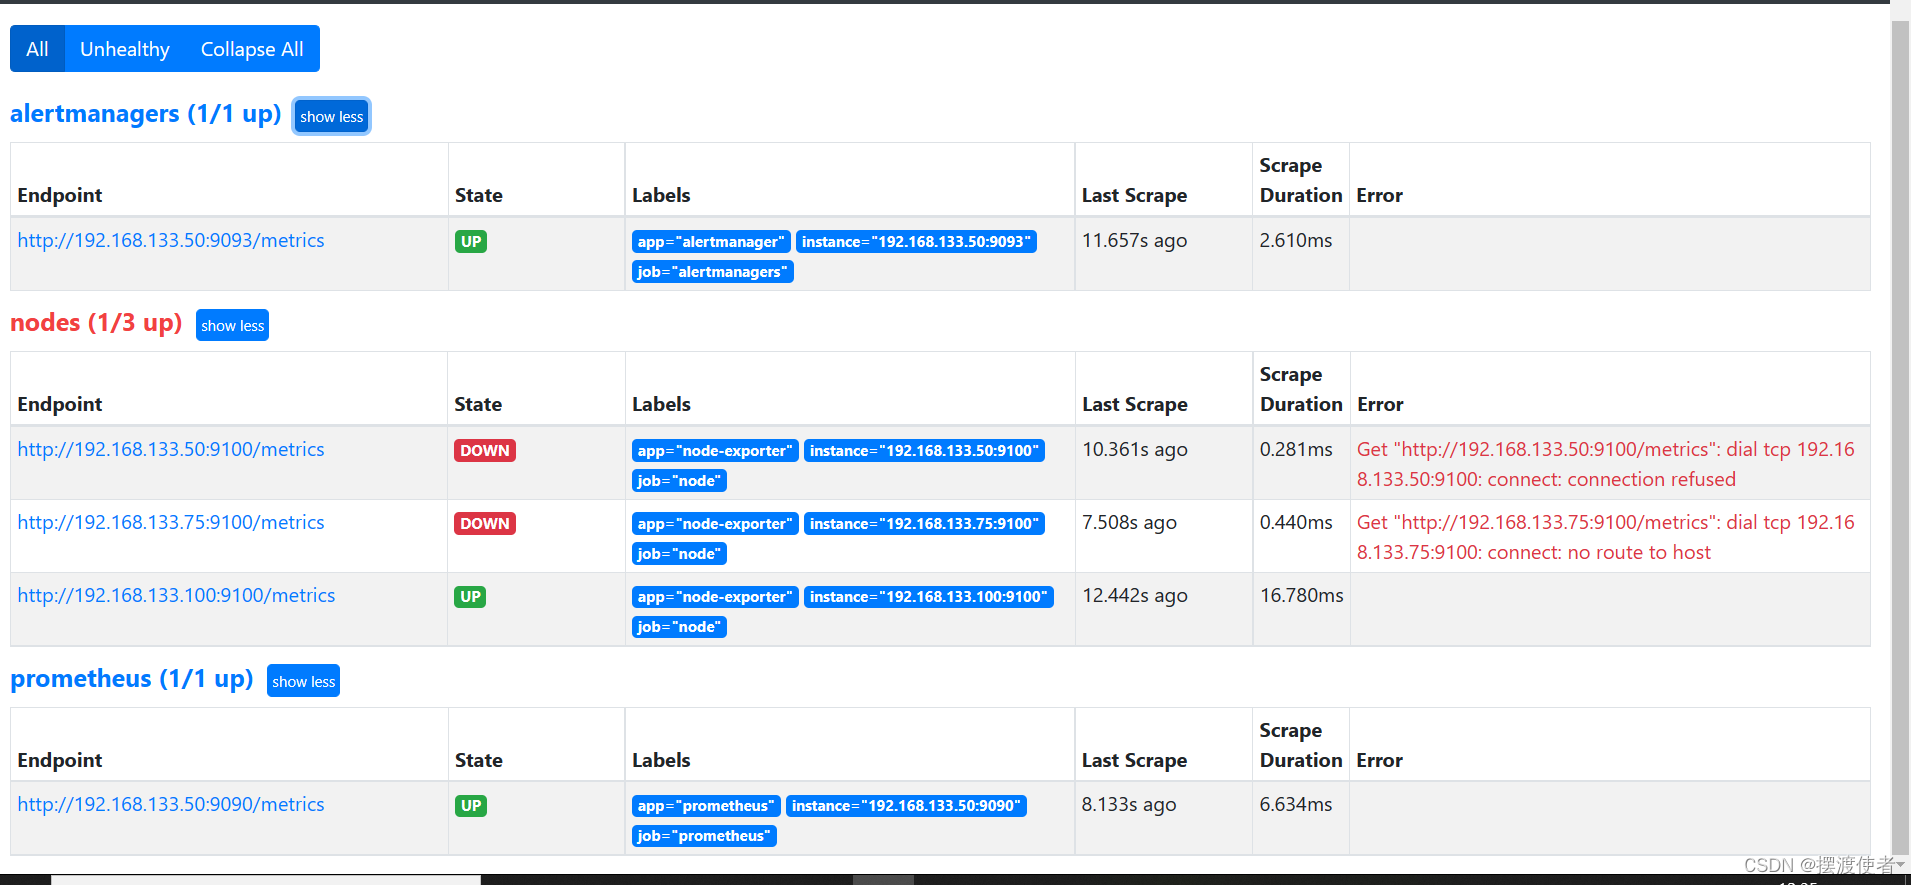
到浏览器查看
本文来自互联网用户投稿,文章观点仅代表作者本人,不代表本站立场,不承担相关法律责任。如若转载,请注明出处。 如若内容造成侵权/违法违规/事实不符,请点击【内容举报】进行投诉反馈!