在Matlab中使用barweb绘制带方差的分组柱状图时的几个注意事项
题目:在Matlab中使用barweb绘制带方差的分组柱状图时的几个注意事项
注:本人电脑上安装有Matlab r2009b, r2014a, r2017b三个Matlab版本,其中r2009b, r2014a对应文中提到的Matlab低版本,r2017b对应文中提到的Matlab高版本;程序在本人电脑上的测试通过,不同Matlab可能会出现新的问题。
Matlab自带的bar加上errorbar功能有限,不能绘制有分组情况下的带方差的柱状图(bar本身可以绘制有分组的柱状图但不能带方差,bar+errorbar联合使用可绘制带方差的柱状图但不能分组),此时一般使用barweb函数,这是一个由第三方个人编写的函数,链接如下:
https://ww2.mathworks.cn/matlabcentral/fileexchange/10803-barweb-bargraph-with-error-bars

编写如下示例程序barweb_demo.m:
(注:由于数据X和E均由rand随机生成的,所以每次运行所得图形是不同的):
%barweb使用举例@2019-09-04
close all;clear;clc;
X = 5+rand(6,3);%随机生成数据
E = rand(6,3);%随机生成误差legends = {'Type-I','Type-II','Type-III'};
groupnames = cell(6,1);
groupnames{1} = 'Group1';groupnames{2} = 'Group2';groupnames{3} = 'Group3';
groupnames{4} = 'Group4';groupnames{5} = 'Group5';groupnames{6} = 'Group6';
Title = 'title of barweb example';
Xlabel = 'xlabel of barweb example';
Ylabel = 'ylabel of barweb exampe';barweb(X,E,1,groupnames,Title,Xlabel,Ylabel,jet,'none',legends,2,'plot');
若你的Matlab版本比较低,例如Matlab R2014,那么应该可以正常运行:

注:如果不想显示横轴、纵轴、图片标题,则将对应的参数用[]替代即可,例如:
barweb(X,E,1,groupnames,Title,[],Ylabel,jet,'none',legends,2,'plot');则将不再显示横轴的“xlabel of barweb example”内容;
但你的若Matlab版本比较高,例如Matlab R2017,运行时会出错:

这时可能会看到barweb主页上的评论:
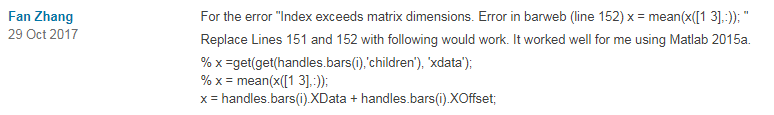
即出错位置在原程序的如下位置:
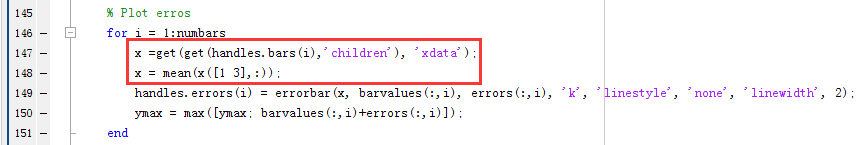
将以上两行注释掉,换成:
x = handles.bars(i).XData + handles.bars(i).XOffset;这时再运行示例程序barweb_demo.m就不报错了:

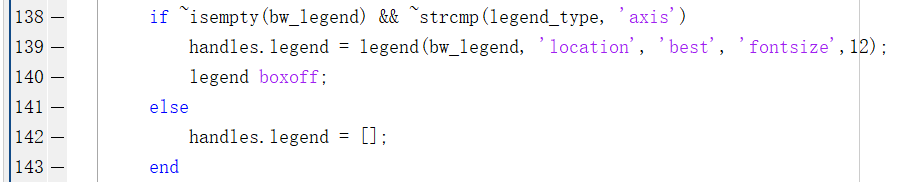
你会发现那个legend显示是有问题的,除了想要的Type-I、Type-II、Type-III之外,还有多余的data1、data2、data3(另外legend显示的位置也有问题,这个后面再说)。这个是因为原先138~143行绘制legend的代码有问题:
只要将这段代码换个位置,剪切至%Plot erros部分的for循环之后就可以了,如下:

这时再次运行示例程序barweb_demo.m,一切就正常了:

但是,倘若有一天你又在低版本Matlab上使用该修改过后的程序,发现又会报错:

其实,原作者的程序是没错的。之所以部分人直接运行时会报错,主要是由于不同版本的Matlab软件中函数bar的返回值不同。在Matlab的Command Window中输入命令help bar,然后打开函数bar的帮助文档:
以下是Matlab r2009b中的帮助文档部分截图:

以下是Matlab r2014a中的帮助文档部分截图:

以下是Matlab r2017b中的帮助文档部分截图:

对比一下可以发现,R2009b和R2014a的返回值是a vector of handles,而R2017b的返回值是one or more Bar objects,原作者的程序只适用于返回值是a vector of handles的Matlab版本,而按barweb主页上的评论修改后的程序只适用于返回值是one or more Bar objects的Matlab版本。所以具体使用哪个版本,要自己根据自己的Matlab版本中bar函数的返回值确定。为了使修改后的barweb函数适应不同Matlab版本中bar函数这两种不同的返回值,可将%Plot erros部分的for循环做如下修改:

也就是使用if…else…语句判断bar函数返回值的类型,进而选择执行相应的代码。
对于legend显示的位置问题,只要针对性修改如下代码即可:
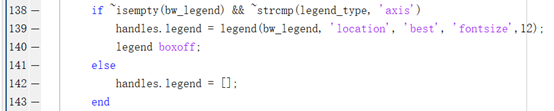
可以发现,目前legend显示位置’location’的参数值为’best’,可以把这个参数值去掉,即将原代码第139行改为
handles.legend = legend(bw_legend, 'fontsize', 12);此时legend会按’location’ 的默认参数设置,显示在图形的左上角:

另外还可以将接下来的legend boxoff;注释掉,legend示例会有边框:

当然还可以修改上面的’fontsize’参数,改变legend示例的字号大小;更多设置那就自己摸索吧。
另外,还可能要修改图形的标题、横轴、纵轴的显示格式,尤其是字号大小,可通过barweb函数的如下代码修改:
if ~isempty(bw_title)title(bw_title, 'fontsize',14);endif ~isempty(bw_xlabel)xlabel(bw_xlabel, 'fontsize',14);endif ~isempty(bw_ylabel)ylabel(bw_ylabel, 'fontsize',14);end相信一般人都熟悉使用title, xlabel, ylabel三个函数分别设置figure的标题、横轴、纵轴。
若想修改group的内容,即本例中横轴的Group1~Group6的格式,应该修改barweb原来的第180行:
set(gca, 'xticklabel', groupnames, 'box', 'off', 'ticklength', [0 0], 'fontsize', 12, 'xtick',1:numgroups, 'linewidth', 2,'xgrid','off','ygrid','off');更多修改设置可以大致浏览一下barweb函数源码;实际上,barweb就是结合了bar和errorbar两个函数,关键是errorbar不能适用于带分组的情形,因此特别调整了一下而已。
最后,说一个图片存储的技巧:平时可以使用“文件--->另存为”(save as),选择自己想要的格式保存即可,但如此存储的图片白色边框会比较大。还可以运行如下语句保存图片:
print('barweb_example','-depsc2','-r600');其中,barweb_example是文件名,-depsc2是文件格式,-r600是图片分辨率。可以help print,打开print函数的帮助文档查看,例如对-depsc2参数的解释:

即存储为EPS彩色图片;
对-r600的解释:

即此处的number=600。单独运行以上语句时,若有多张图片,最新单击浏览了哪张图片就会存储哪张图片。
这里的柱状图的填充颜色都是随机的,如果黑白打印的话显示效果就不好了,如果能用不同的条纹填充就最好了,这时可以使用另外一个第三方个人写的函数:applyhatch,链接如下:
http://www.aos.wisc.edu/~dvimont/matlab/Graphics_Tools/applyhatch.html
或者applyhatch_plusC,链接如下:
https://ww2.mathworks.cn/matlabcentral/fileexchange/26797-applyhatch_plusc
但效果并不是特别好,这里就不说了,需要的话可以自行探索使用方法。
附录1:barweb修改后的代码(兼容多版本Matlab,修改了原先138~143行绘制legend的代码)
function handles = barweb(barvalues, errors, width, groupnames, bw_title, bw_xlabel, bw_ylabel, bw_colormap, gridstatus, bw_legend, error_sides, legend_type)
%
% Usage: handles = barweb(barvalues, errors, width, groupnames, bw_title, bw_xlabel, bw_ylabel, bw_colormap, gridstatus, bw_legend, error_sides, legend_type)
%
% Ex: handles = barweb(my_barvalues, my_errors, [], [], [], [], [], bone, [], bw_legend, 1, 'axis')
%
% barweb is the m-by-n matrix of barvalues to be plotted.
% barweb calls the MATLAB bar function and plots m groups of n bars using the width and bw_colormap parameters.
% If you want all the bars to be the same color, then set bw_colormap equal to the RBG matrix value ie. (bw_colormap = [1 0 0] for all red bars)
% barweb then calls the MATLAB errorbar function to draw barvalues with error bars of length error.
% groupnames is an m-length cellstr vector of groupnames (i.e. groupnames = {'group 1'; 'group 2'}).  For no groupnames, enter [] or {}
% The errors matrix is of the same form of the barvalues matrix, namely m group of n errors.
% Gridstatus is either 'x','xy', 'y', or 'none' for no grid.
% No legend will be shown if the legend paramter is not provided
% 'error_sides = 2' plots +/- std while 'error_sides = 1' plots just + std
% legend_type = 'axis' produces the legend along the x-axis while legend_type = 'plot' produces the standard legend.  See figure for more details
%
% The following default values are used if parameters are left out or skipped by using [].
% width = 1 (0 < width < 1; widths greater than 1 will produce overlapping bars)
% groupnames = '1', '2', ... number_of_groups
% bw_title, bw_xlabel, bw_ylabel = []
% bw_color_map = jet
% gridstatus = 'none'
% bw_legend = []
% error_sides = 2;
% legend_type = 'plot';
%
% A list of handles are returned so that the user can change the properties of the plot
% handles.ax: handle to current axis
% handles.bars: handle to bar plot
% handles.errors: a vector of handles to the error plots, with each handle corresponding to a column in the error matrix
% handles.legend: handle to legend
%
%
% See the MATLAB functions bar and errorbar for more information
%
% Author: Bolu Ajiboye
% Created: October 18, 2005 (ver 1.0)
% Updated: Dec 07, 2006 (ver 2.1)
% Updated: July 21, 2008 (ver 2.3)
% Get function arguments
if nargin < 2error('Must have at least the first two arguments:  barweb(barvalues, errors, width, groupnames, bw_title, bw_xlabel, bw_ylabel, bw_colormap, gridstatus, bw_legend, barwebtype)');
elseif nargin == 2width = 1;groupnames = 1:size(barvalues,1);bw_title = [];bw_xlabel = [];bw_ylabel = [];bw_colormap = jet;gridstatus = 'none';bw_legend = [];error_sides = 2;legend_type = 'plot';
elseif nargin == 3groupnames = 1:size(barvalues,1);bw_title = [];bw_xlabel = [];bw_ylabel = [];bw_colormap = jet;gridstatus = 'none';bw_legend = [];error_sides = 2;legend_type = 'plot';
elseif nargin == 4bw_title = [];bw_xlabel = [];bw_ylabel = [];bw_colormap = jet;gridstatus = 'none';bw_legend = [];error_sides = 2;legend_type = 'plot';
elseif nargin == 5bw_xlabel = [];bw_ylabel = [];bw_colormap = jet;gridstatus = 'none';bw_legend = [];error_sides = 2;legend_type = 'plot';
elseif nargin == 6bw_ylabel = [];bw_colormap = jet;gridstatus = 'none';bw_legend = [];error_sides = 2;legend_type = 'plot';
elseif nargin == 7bw_colormap = jet;gridstatus = 'none';bw_legend = [];error_sides = 2;legend_type = 'plot';
elseif nargin == 8gridstatus = 'none';bw_legend = [];error_sides = 2;legend_type = 'plot';
elseif nargin == 9bw_legend = [];error_sides = 2;legend_type = 'plot';
elseif nargin == 10error_sides = 2;legend_type = 'plot';
elseif nargin == 11legend_type = 'plot';
end
change_axis = 0;
ymax = 0;
if size(barvalues,1) ~= size(errors,1) || size(barvalues,2) ~= size(errors,2)error('barvalues and errors matrix must be of same dimension');
elseif size(barvalues,2) == 1barvalues = barvalues';errors = errors';endif size(barvalues,1) == 1barvalues = [barvalues; zeros(1,length(barvalues))];errors = [errors; zeros(1,size(barvalues,2))];change_axis = 1;endnumgroups = size(barvalues, 1); % number of groupsnumbars = size(barvalues, 2); % number of bars in a groupif isempty(width)width = 1;end% Plot barshandles.bars = bar(barvalues, width, 'edgecolor','k', 'linewidth', 2);hold onif ~isempty(bw_colormap)colormap(bw_colormap);elsecolormap(jet);end% Plot errosfor i = 1:numbarsbar_versions = class(handles.bars(i));if strcmp(bar_versions,'double')x =get(get(handles.bars(i),'children'), 'xdata');x = mean(x([1 3],:));elsex = handles.bars(i).XData + handles.bars(i).XOffset;endhandles.errors(i) = errorbar(x, barvalues(:,i), errors(:,i), 'k', 'linestyle', 'none', 'linewidth', 2);ymax = max([ymax; barvalues(:,i)+errors(:,i)]);endif ~isempty(bw_legend) && ~strcmp(legend_type, 'axis')handles.legend = legend(bw_legend, 'fontsize',12);%'location', 'best',
% 		legend boxoff;elsehandles.legend = [];endif error_sides == 1set(gca,'children', flipud(get(gca,'children')));endylim([0 ymax*1.1]);xlim([0.5 numgroups-change_axis+0.5]);if strcmp(legend_type, 'axis')for i = 1:numbarsxdata = get(handles.errors(i),'xdata');for j = 1:length(xdata)text(xdata(j),  -0.03*ymax*1.1, bw_legend(i), 'Rotation', 60, 'fontsize', 12, 'HorizontalAlignment', 'right');endendset(gca,'xaxislocation','top');endif ~isempty(bw_title)title(bw_title, 'fontsize',14);endif ~isempty(bw_xlabel)xlabel(bw_xlabel, 'fontsize',14);endif ~isempty(bw_ylabel)ylabel(bw_ylabel, 'fontsize',14);endset(gca, 'xticklabel', groupnames, 'box', 'off', 'ticklength', [0 0], 'fontsize', 12, 'xtick',1:numgroups, 'linewidth', 2,'xgrid','off','ygrid','off');if ~isempty(gridstatus) && any(gridstatus == 'x')set(gca,'xgrid','on');endif ~isempty(gridstatus) && any(gridstatus ==  'y')set(gca,'ygrid','on');endhandles.ax = gca;hold off
end
附录2:barweb原来代码(可以在开篇给出的链接中复制,放在此处仅作备份)
function handles = barweb(barvalues, errors, width, groupnames, bw_title, bw_xlabel, bw_ylabel, bw_colormap, gridstatus, bw_legend, error_sides, legend_type)
%
% Usage: handles = barweb(barvalues, errors, width, groupnames, bw_title, bw_xlabel, bw_ylabel, bw_colormap, gridstatus, bw_legend, error_sides, legend_type)
%
% Ex: handles = barweb(my_barvalues, my_errors, [], [], [], [], [], bone, [], bw_legend, 1, 'axis')
%
% barweb is the m-by-n matrix of barvalues to be plotted.
% barweb calls the MATLAB bar function and plots m groups of n bars using the width and bw_colormap parameters.
% If you want all the bars to be the same color, then set bw_colormap equal to the RBG matrix value ie. (bw_colormap = [1 0 0] for all red bars)
% barweb then calls the MATLAB errorbar function to draw barvalues with error bars of length error.
% groupnames is an m-length cellstr vector of groupnames (i.e. groupnames = {'group 1'; 'group 2'}).  For no groupnames, enter [] or {}
% The errors matrix is of the same form of the barvalues matrix, namely m group of n errors.
% Gridstatus is either 'x','xy', 'y', or 'none' for no grid.
% No legend will be shown if the legend paramter is not provided
% 'error_sides = 2' plots +/- std while 'error_sides = 1' plots just + std
% legend_type = 'axis' produces the legend along the x-axis while legend_type = 'plot' produces the standard legend.  See figure for more details
%
% The following default values are used if parameters are left out or skipped by using [].
% width = 1 (0 < width < 1; widths greater than 1 will produce overlapping bars)
% groupnames = '1', '2', ... number_of_groups
% bw_title, bw_xlabel, bw_ylabel = []
% bw_color_map = jet
% gridstatus = 'none'
% bw_legend = []
% error_sides = 2;
% legend_type = 'plot';
%
% A list of handles are returned so that the user can change the properties of the plot
% handles.ax: handle to current axis
% handles.bars: handle to bar plot
% handles.errors: a vector of handles to the error plots, with each handle corresponding to a column in the error matrix
% handles.legend: handle to legend
%
%
% See the MATLAB functions bar and errorbar for more information
%
% Author: Bolu Ajiboye
% Created: October 18, 2005 (ver 1.0)
% Updated: Dec 07, 2006 (ver 2.1)
% Updated: July 21, 2008 (ver 2.3)
% Get function arguments
if nargin < 2error('Must have at least the first two arguments:  barweb(barvalues, errors, width, groupnames, bw_title, bw_xlabel, bw_ylabel, bw_colormap, gridstatus, bw_legend, barwebtype)');
elseif nargin == 2width = 1;groupnames = 1:size(barvalues,1);bw_title = [];bw_xlabel = [];bw_ylabel = [];bw_colormap = jet;gridstatus = 'none';bw_legend = [];error_sides = 2;legend_type = 'plot';
elseif nargin == 3groupnames = 1:size(barvalues,1);bw_title = [];bw_xlabel = [];bw_ylabel = [];bw_colormap = jet;gridstatus = 'none';bw_legend = [];error_sides = 2;legend_type = 'plot';
elseif nargin == 4bw_title = [];bw_xlabel = [];bw_ylabel = [];bw_colormap = jet;gridstatus = 'none';bw_legend = [];error_sides = 2;legend_type = 'plot';
elseif nargin == 5bw_xlabel = [];bw_ylabel = [];bw_colormap = jet;gridstatus = 'none';bw_legend = [];error_sides = 2;legend_type = 'plot';
elseif nargin == 6bw_ylabel = [];bw_colormap = jet;gridstatus = 'none';bw_legend = [];error_sides = 2;legend_type = 'plot';
elseif nargin == 7bw_colormap = jet;gridstatus = 'none';bw_legend = [];error_sides = 2;legend_type = 'plot';
elseif nargin == 8gridstatus = 'none';bw_legend = [];error_sides = 2;legend_type = 'plot';
elseif nargin == 9bw_legend = [];error_sides = 2;legend_type = 'plot';
elseif nargin == 10error_sides = 2;legend_type = 'plot';
elseif nargin == 11legend_type = 'plot';
end
change_axis = 0;
ymax = 0;
if size(barvalues,1) ~= size(errors,1) || size(barvalues,2) ~= size(errors,2)error('barvalues and errors matrix must be of same dimension');
elseif size(barvalues,2) == 1barvalues = barvalues';errors = errors';endif size(barvalues,1) == 1barvalues = [barvalues; zeros(1,length(barvalues))];errors = [errors; zeros(1,size(barvalues,2))];change_axis = 1;endnumgroups = size(barvalues, 1); % number of groupsnumbars = size(barvalues, 2); % number of bars in a groupif isempty(width)width = 1;end% Plot barshandles.bars = bar(barvalues, width,'edgecolor','k', 'linewidth', 2);hold onif ~isempty(bw_colormap)colormap(bw_colormap);elsecolormap(jet);endif ~isempty(bw_legend) && ~strcmp(legend_type, 'axis')handles.legend = legend(bw_legend, 'location', 'best', 'fontsize',12);legend boxoff;elsehandles.legend = [];end% Plot errosfor i = 1:numbarsx =get(get(handles.bars(i),'children'), 'xdata');x = mean(x([1 3],:));handles.errors(i) = errorbar(x, barvalues(:,i), errors(:,i), 'k', 'linestyle', 'none', 'linewidth', 2);ymax = max([ymax; barvalues(:,i)+errors(:,i)]);endif error_sides == 1set(gca,'children', flipud(get(gca,'children')));endylim([0 ymax*1.1]);xlim([0.5 numgroups-change_axis+0.5]);if strcmp(legend_type, 'axis')for i = 1:numbarsxdata = get(handles.errors(i),'xdata');for j = 1:length(xdata)text(xdata(j),  -0.03*ymax*1.1, bw_legend(i), 'Rotation', 60, 'fontsize', 12, 'HorizontalAlignment', 'right');endendset(gca,'xaxislocation','top');endif ~isempty(bw_title)title(bw_title, 'fontsize',14);endif ~isempty(bw_xlabel)xlabel(bw_xlabel, 'fontsize',14);endif ~isempty(bw_ylabel)ylabel(bw_ylabel, 'fontsize',14);endset(gca, 'xticklabel', groupnames, 'box', 'off', 'ticklength', [0 0], 'fontsize', 12, 'xtick',1:numgroups, 'linewidth', 2,'xgrid','off','ygrid','off');if ~isempty(gridstatus) && any(gridstatus == 'x')set(gca,'xgrid','on');endif ~isempty(gridstatus) && any(gridstatus ==  'y')set(gca,'ygrid','on');endhandles.ax = gca;hold off
end
本文来自互联网用户投稿,文章观点仅代表作者本人,不代表本站立场,不承担相关法律责任。如若转载,请注明出处。 如若内容造成侵权/违法违规/事实不符,请点击【内容举报】进行投诉反馈!