vue el-table联合插件sparkline完成表格中的迷你图
首先要先引入jquery.sparkline.js,没有的朋友可以去官网下载,[https://omnipotent.net/jquery.sparkline/#s-about]
el-table代码:
<el-table-column prop="charts" label="..." align="center" min-width="160px"><template slot-scope="scope">{{ drawCharts(scope.row, scope.$index) }}<div @click="openDetails(scope.$index, scope.row)" :id="'sparkline-index' + scope.$index" class="tiger-trend-charts"></div></template></el-table-column>
这里openDetails是点击后放大的一个echarts图形方法。
js代码
drawCharts: function (row, index) {var _this = this;this.$nextTick(function () {var data = [];for (var i = 0; i < _this.table.length; i++) {data.push(_this.table[i].kl);}$("#sparkline-index" + index).sparkline(data, {type: 'line',width: '130px',height: '30px',lineColor: '#5096ff',spotColor: '',fillColor: ''});})},
这里主要运用动态的id去渲染sparkline。
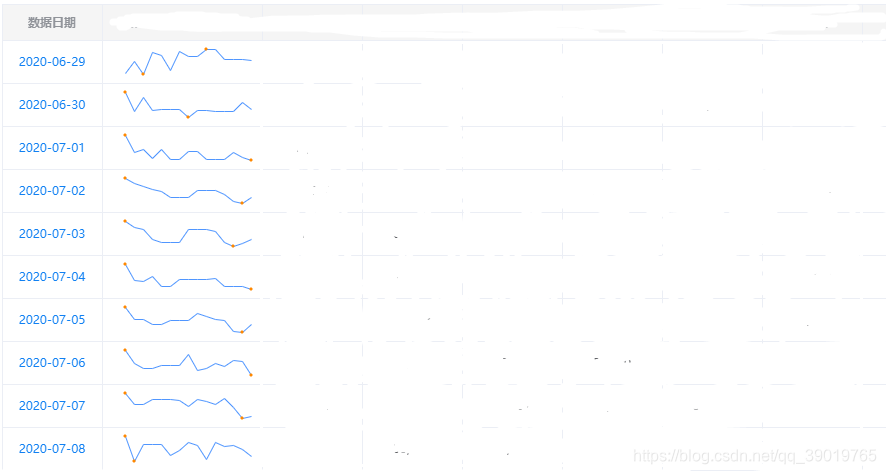
最终的效果
本文来自互联网用户投稿,文章观点仅代表作者本人,不代表本站立场,不承担相关法律责任。如若转载,请注明出处。 如若内容造成侵权/违法违规/事实不符,请点击【内容举报】进行投诉反馈!