A common architecture for all Sentinel Toolboxes is being jointly developed by Brockmann Consult, SkyWatch and C-S called the Sentinel Application Platform (SNAP).
SNAP全称Sentinel Application Platform,是欧空局开发的卫星数据科学探索通用工具箱。SNAP 为处理、建模和可视化卫星图像提供了一个直观的平台,特别是对于哨兵任务。该软件经过优化,可以处理大量卫星数据。它还有助于处理 SAR 数据,例如来自 Sentinel-1 的数据。
INFO: org.esa.snap.core.gpf.operators.tooladapter.ToolAdapterIO: Initializing external tool adapters
INFO: org.esa.s2tbx.dataio.gdal.GDALVersion: GDAL not found on system. Internal GDAL 3.2.1 from distribution will be used. (f0)
INFO: org.esa.s2tbx.dataio.gdal.GDALVersion: Internal GDAL 3.2.1 set to be used by SNAP.
INFO: org.esa.snap.core.util.EngineVersionCheckActivator: Please check regularly for new updates for the best SNAP experience.
INFO: org.esa.s2tbx.dataio.gdal.GDALVersion: Internal GDAL 3.2.1 set to be used by SNAP.
Usage:gpt <op>|<graph-file>[options][<source-file-1><source-file-2>...]Description:This tool is used to execute SNAP raster data operators in batch-mode. Theoperators can be used stand-alone or combined as a directed acyclic graph(DAG). Processing graphs are represented using XML. More info aboutprocessing graphs, the operator API, and the graph XML format can be foundin the SNAP documentation.Arguments:<op> Name of an operator. See below for the list of <op>s.<graph-file> Operator graph file(XML format).<source-file-i> The <i>th source product file. The actual number of sourcefile arguments is specified by <op>. May be optional foroperators which use the -S option.Options:-h Displays command usage. If <op> is given, the specificoperator usage is displayed.-e Displays more detailed error messages. Displays a stacktrace, if an exception occurs.-t <file> The target file. Default value is 'target.dim'.-f <format> Output file format, e.g. 'GeoTIFF', 'HDF5','BEAM-DIMAP'. If not specified, format will be derivedfrom the target filename extension, if any, otherwise thedefault format is 'BEAM-DIMAP'. Ony used, if the graphin<graph-file> does not specify its own 'Write'operator.-p <file> A (Java Properties)file containing processing parametersin the form <name>=<value> or a XML file containing aparameter DOM for the operator. Entries in this file areoverwritten by the -P<name>=<value> command-line option(see below). The following variables are substituted inthe parameters file:${system.}${operatorName}(given by the <op> argument)${graphFile}(given by the <graph-file> argument)${targetFile}(pull path given by the -t option)${targetDir}(derived from -t option)${targetName}(derived from -t option)${targetBaseName}(derived from -t option)${targetFormat}(given by the -f option)-c <cache-size> Sets the tile cache size in bytes. Value can be suffixedwith 'K', 'M' and 'G'. Must be less than maximumavailable heap space. If equal to or less than zero, tilecaching will be completely disabled. The default tilecache size is '1,073,741,824M'.-q <parallelism> Sets the maximum parallelism used for the computation,i.e. the maximum number of parallel (native) threads.The default parallelism is '8'.-x Clears the internal tile cache after writing a completerow of tiles to the target product file. This option maybe useful if you run into memory problems.-S<source>=<file> Defines a source product. <source> is specified by theoperator or the graph. In an XML graph, all occurrences of${} will be replaced with references to a sourceproduct located at <file>.-P<name>=<value> Defines a processing parameter, <name> is specific for theused operator or graph. In an XML graph, all occurrencesof ${} will be replaced with <value>. Overwritesparameter values specified by the '-p' option.-D<name>=<value> Defines a system property for this invocation.-v <dir> A directory containing any number of Velocity templates.Each template generates a text output file along with thetarget product. This feature has been added to support aflexible generation of metadata files.See http://velocity.apache.org/ and option -m.-m <file> A (Java Properties)file containing (constant) metadatain the form <name>=<value> or any XML file. Its primaryusage is to provide an additional context to be usedfrom within the Velocity templates. See option -v.--diag Displays version and diagnostic information.
Operators:Aatsr.SST Computes sea surface temperature (SST) from (A)ATSR products.AATSR.Ungrid Ungrids (A)ATSR L1B products and extracts geolocation and pixel field of view data.AdaptiveThresholding Detect ships using Constant False Alarm Rate detector.AddElevation Creates a DEM bandAddLandCover Creates a land cover bandALOS-Deskewing Deskewing ALOS productApply-Orbit-File Apply orbit fileArc.SST Computes sea surface temperature (SST) from (A)ATSR and SLSTR products.ArviOp Atmospherically Resistant Vegetation Index belongs to a family of indices with built-in atmospheric corrections.Azimuth-Shift-Estimation-ESD Estimate azimuth offset for the whole imageAzimuthFilter Azimuth FilterBack-Geocoding Bursts co-registration using orbit and DEMBandMaths Create a product with one or more bands using mathematical expressions.BandMerge Allows copying raster data from any number of source products to a specified 'master' product.BandPassFilter Creates a basebanded SLC based on a subband of 1/3 the original bandwidthBandsDifferenceOp No description available.BandSelect Creates a new product with only selected bandsBandsExtractorOp Creates a new product out of the source product containing only the indexes bands givenBi2Op The Brightness index represents the average of the brightness of a satellite image.This index is sensitive to the brightness of soils which is highly correlated with the humidity and the presence of salts in surfaceBinning Performs spatial and temporal aggregation of pixel values into cells ('bins') of a planetary gridBiOp The Brightness index represents the average of the brightness of a satellite image.Biophysical10mOp The 'Biophysical Processor' operator retrieves LAI from atmospherically corrected Sentinel-2 productsBiophysicalLandsat8Op The 'Biophysical Processor' operator retrieves LAI from atmospherically corrected Landsat8 productsBiophysicalOp The 'Biophysical Processor' operator retrieves LAI from atmospherically corrected Sentinel-2 productsc2rcc.landsat8 Performs atmospheric correction and IOP retrieval with uncertainties on Landsat-8 L1 data products.c2rcc.meris Performs atmospheric correction and IOP retrieval with uncertainties on MERIS L1b data products.c2rcc.meris4 Performs atmospheric correction and IOP retrieval with uncertainties on MERIS L1b data products from the 4th reprocessing.c2rcc.modis Performs atmospheric correction and IOP retrieval on MODIS L1C_LAC data products.c2rcc.msi Performs atmospheric correction and IOP retrieval with uncertainties on Sentinel-2 MSI L1C data products.c2rcc.olci Performs atmospheric correction and IOP retrieval with uncertainties on SENTINEL-3 OLCI L1B data products.c2rcc.seawifs Performs atmospheric correction and IOP retrieval on SeaWifs L1C data products.c2rcc.viirs Performs atmospheric correction and IOP retrieval on Viirs L1C data products.Calibration Calibration of productsChange-Detection Change Detection.ChangeVectorAnalysisOp The 'Change Vector Analysis' between two dual bands at two differents dates.CiOp Colour Index was developed to differentiate soils in the field.In most cases the CI gives complementary information with the BI and the NDVI.Used for diachronic analyses, they helpfor a better understanding of the evolution of soil surfaces.CloudProb Applies a clear sky conservative cloud detection algorithm.Coherence Estimate coherence from stack of coregistered imagesCollocate Collocates two products based on their geo-codings.Compactpol-Radar-Vegetation-Index Compact-pol Radar Vegetation Indices generationCompute-Slope-Aspect Compute Slope and Aspect from DEMConvert-Datatype Convert product data typeCoregistrationOp Coregisters two rasters, not considering their locationCP-Decomposition Perform Compact Polarimetric decomposition of a given productCP-Simulation Simulation of Compact Pol data from Quad Pol dataCP-Stokes-Parameters Generates compact polarimetric Stokes child parametersCreateStack Collocates two or more products based on their geo-codings.Cross-Channel-SNR-Correction Compute general polarimetric parametersCross-Correlation Automatic Selection of Ground Control PointsCrossResampling Estimate Resampling Polynomial using SAR Image Geometry, and Resample Input ImagesDarkObjectSubtraction Performs dark object subtraction for spectral bands insource product.DeburstWSS Debursts an ASAR WSS productDecisionTree Perform decision tree classificationDEM-Assisted-Coregistration Orbit and DEM based co-registrationDemodulate Demodulation and deramping of SLC dataDouble-Difference-Interferogram Compute double difference interferogramDviOp Difference Vegetation Index retrieves the Isovegetation lines parallel to soil lineEAP-Phase-Correction EAP Phase CorrectionEllipsoid-Correction-GG GG method for orthorectificationEllipsoid-Correction-RD Ellipsoid correction with RD method and average scene heightEMClusterAnalysis Performs an expectation-maximization (EM) cluster analysis.Enhanced-Spectral-Diversity Estimate constant range and azimuth offsets for a stack of imagesFaraday-Rotation-Correction Perform Faraday-rotation correction for quad-pol productFill-DEM-Hole Fill holes in given DEM product file.FlhMci Computes fluorescence line height (FLH) or maximum chlorophyll index (MCI).Flip flips a product horizontal/verticalForestCoverChangeOp Creates forest change masks out of two source productsFUB.Water MERIS FUB-CSIRO Coastal Water Processor to retrieve case II water properties and atmospheric propertiesFuClassification Colour classification based on the discrete Forel-Ule scaleGemiOp This retrieves the Global Environmental Monitoring Index (GEMI).Generalized-Radar-Vegetation-Index Generalized Radar Vegetation Indices generationGenericRegionMergingOp The 'Generic Region Merging' operator computes the distinct regions from a productGLCM Extract Texture FeaturesGndviOp Green Normalized Difference Vegetation IndexGoldsteinPhaseFiltering Phase FilteringGRD-Post Applies GRD post-processingHorizontalVerticalMotion Computation of Horizontal/Vertical Motion ComponentsIEM-Hybrid-Inversion Performs IEM inversion using Hybrid approachIEM-Multi-Angle-Inversion Performs IEM inversion using Multi-angle approachIEM-Multi-Pol-Inversion Performs IEM inversion using Multi-polarization approachImage-Filter Common Image Processing FiltersImport-Vector Imports a shape file into a productIntegerInterferogram Create integer interferogramInterferogram Compute interferograms from stack of coregistered S-1 imagesIonosphericCorrection Estimation of Ionospheric Phase ScreensIpviOp Infrared Percentage Vegetation Index retrieves the Isovegetation lines converge at originIreciOp Inverted red-edge chlorophyll indexKDTree-KNN-Classifier KDTree KNN classifierKMeansClusterAnalysis Performs a K-Means cluster analysis.KNN-Classifier K-Nearest Neighbour classifierLand-Cover-Mask Perform decision tree classificationLand-Sea-Mask Creates a bitmask defining land vs ocean.LandWaterMask Operator creating a target product with a single band containing a land/water-mask.LinearToFromdB Converts bands to/from dBMaximum-Likelihood-Classifier Maximum Likelihood classifierMcariOp Modified Chlorophyll Absorption Ratio Index, developed to be responsive to chlorophyll variationMci.s2 Computes maximum chlorophyll index (MCI)for Sentinel-2 MSI.Merge Allows merging of several source products by using specified 'master' as reference product.Meris.Adapt.4To3 Provides the adaptation of MERIS L1b products from 4th to 3rd reprocessing.Meris.CorrectRadiometry Performs radiometric corrections on MERIS L1b data products.Meris.N1Patcher Copies an existing N1 file and replaces the data for the radiance bandsMinimum-Distance-Classifier Minimum Distance classifierMndwiOp Modified Normalized Difference Water Index, allowing for the measurement of surface water extentMosaic Creates a mosaic out of a set of source products.MphChl This operator computes maximum peak height of chlorophyll (MPH/CHL).Msavi2Op This retrieves the second Modified Soil Adjusted Vegetation Index (MSAVI2).MsaviOp This retrieves the Modified Soil Adjusted Vegetation Index (MSAVI).MtciOp The Meris Terrestrial Chlorophyll Index, aims at estimating the Red Edge Position (REP).This is the maximum slant point in the red and near-infrared region of the vegetal spectral reflectance.It is useful for observing the chlorophyll contents, vegetation senescence, and stress for water and nutritional deficiencies, but it is less suitable for land classificationMulti-size Mosaic Creates a multi-size mosaic out of a set of source products.Multi-Temporal-Speckle-Filter Speckle Reduction using Multitemporal FilteringMultilook Averages the power across a number of lines in both the azimuth and range directionsMultiMasterInSAR Multi-master InSAR processingMultiMasterStackGenerator Generates a set of master-slave pairs from a coregistered stack forusein SBAS processingMultitemporal-Compositing Compute composite image from multi-temporal RTCsNdi45Op Normalized Difference Index using bands 4 and 5NdpiOp The normalized differential pond index, combines the short-wave infrared band-I and the green bandNdtiOp Normalized difference turbidity index, allowing for the measurement of water turbidityNdviOp The retrieves the Normalized Difference Vegetation Index (NDVI).Ndwi2Op The Normalized Difference Water Index, allowing for the measurement of surface water extentNdwiOp The Normalized Difference Water Index was developed for the extraction of water featuresObject-Discrimination Remove false alarms from the detected objects.Offset-Tracking Create velocity vectors from offset trackingOil-Spill-Clustering Remove small clusters from detected area.Oil-Spill-Detection Detect oil spill.OlciAnomalyFlagging Adds a flagging band indicating saturated pixels and altitude data overflowsOlciO2aHarmonisation Performs O2A band harmonisation on OLCI L1b product. Implements update v4 of R.Preusker, June 2020.OlciSensorHarmonisation Performs sensor harmonisation on OLCI L1b product. Implements algorithm described in'OLCI A/B Tandem Phase Analysis'Orientation-Angle-Correction Perform polarization orientation angle correction for given coherency matrixOversample Oversample the datsetOWTClassification Performs an optical water type classification based on atmospherically corrected reflectances.PCA Performs a Principal Component Analysis.PduStitching Stitches multiple SLSTR L1B product dissemination units(PDUs) of the same orbit to a single product.PhaseToDisplacement Phase To Displacement Conversion along LOSPhaseToElevation DEM GenerationPhaseToHeight Phase to Height conversionPixEx Extracts pixels from given locations and source products.Polarimetric-Classification Perform Polarimetric classification of a given productPolarimetric-Decomposition Perform Polarimetric decomposition of a given productPolarimetric-Matrices Generates covariance or coherency matrix for given productPolarimetric-Parameters Compute general polarimetric parametersPolarimetric-Speckle-Filter Polarimetric Speckle ReductionPpeFiltering Performs Prompt Particle Event (PPE) filtering on OLCI L1BPrinciple-Components Principle Component AnalysisProductSet-Reader Adds a list of sourcesPssraOp Pigment Specific Simple Ratio, chlorophyll indexPviOp Perpendicular Vegetation Index retrieves the Isovegetation lines parallel to soil line. Soil line has an arbitrary slope and passes through originRad2Refl Provides conversion from radiances to reflectances or backwards.Radar-Vegetation-Index Dual-pol Radar Vegetation Indices generationRandom-Forest-Classifier Random Forest based classifierRangeFilter Range FilterRayleighCorrection Performs radiometric corrections on OLCI, MERIS L1B and S2 MSI L1C data products.Read Reads a data product from a given file location.ReflectanceToRadianceOp The 'Reflectance To Radiance Processor' operator retrieves the radiance from reflectance using Sentinel-2 productsReipOp The red edge inflection point indexRemodulate Remodulation and reramping of SLC dataRemoteExecutionOp The Remote Execution Processor executes on the remote machines a slave graph and then on the host machine it executes a master graph using the products created by the remote machines.Remove-GRD-Border-Noise Mask no-value pixels for GRD productRemoveAntennaPattern Remove Antenna PatternReplaceMetadata Replace the metadata of the first product with that of the secondReproject Reprojection of a source product to a target Coordinate Reference System.Resample Resampling of a multi-size source product to a single-size target product.RiOp The Redness Index was developed to identify soil colour variations.RviOp Ratio Vegetation Index retrieves the Isovegetation lines converge at originS2repOp Sentinel-2 red-edge position indexS2Resampling Specific S2 resample algorithmSAR-Mosaic Mosaics two or more products based on their geo-codings.SAR-Simulation Rigorous SAR SimulationSARSim-Terrain-Correction Orthorectification with SAR simulationSaviOp This retrieves the Soil-Adjusted Vegetation Index (SAVI).SetNoDataValue Set NoDataValueUsed flag and NoDataValue for all bandsSliceAssembly Merges Sentinel-1 slice productsSM-Dielectric-Modeling Performs SM inversion using dielectric modelSmacOp Applies the Simplified Method for Atmospheric Corrections of Envisat MERIS/(A)ATSR measurements.SnaphuExport Export data and prepare conf filefor SNAPHU processingSnaphuImport Ingest SNAPHU results into InSAR product.Speckle-Divergence Detect urban area.Speckle-Filter Speckle ReductionSpectralAngleMapperOp Classifies a product using the spectral angle mapper algorithmSRGR Converts Slant Range to Ground RangeStack-Averaging Averaging multi-temporal imagesStack-Split Writes all bands to files.StampsExport Export data for StaMPS processingStatisticsOp Computes statistics for an arbitrary number of source products.SubGraph Encapsulates a graph within a graph.Subset Create a spatial and/or spectral subset of a data product.Supervised-Wishart-Classification Perform supervised Wishart classificationTemporalPercentile Computes percentiles over a given time period.Terrain-Correction RD method for orthorectificationTerrain-Flattening Terrain FlatteningTerrain-Mask Terrain Mask GenerationThermalNoiseRemoval Removes thermal noise from productsThree-passDInSAR Differential InterferometryTileCache Experimental Operator which provides a dedicated cache for its source product.A guide on how this operator is used is provided at https://senbox.atlassian.net/wiki/x/VQCTLw.TileWriter Writes a data product to a tiles.TndviOp Transformed Normalized Difference Vegetation Index retrieves the Isovegetation lines parallel to soil lineToolAdapterOp Tool Adapter OperatorTopoPhaseRemoval Compute and subtract TOPO phaseTOPSAR-Deburst Debursts a Sentinel-1 TOPSAR productTOPSAR-DerampDemod Bursts co-registration using orbit and DEMTOPSAR-Merge Merge subswaths of a Sentinel-1 TOPSAR productTOPSAR-Split Creates a new product with only the selected subswathTsaviOp This retrieves the Transformed Soil Adjusted Vegetation Index (TSAVI).Undersample Undersample the datsetUnmix Performs a linear spectral unmixing.Update-Geo-Reference Update Geo ReferenceWarp Create Warp Function And Get Co-registrated ImagesWdviOp Weighted Difference Vegetation Index retrieves the Isovegetation lines parallel to soil line. Soil line has an arbitrary slope and passes through originWind-Field-Estimation Estimate wind speed and directionWrite Writes a data product to a file.
Usage: matlab [-h|-help]|[-n | -e][v=variant][-c licensefile][-display Xdisplay | -nodisplay][--noFigureWindows][-nosplash][-debug][-softwareopengl | -nosoftwareopengl][-desktop | -nodesktop | -nojvm][-batch MATLAB_command | -r MATLAB_command][-sd folder | -useStartupFolderPref][-logfile log][-singleCompThread][-jdb [port]][-Ddebugger [options]][-nouserjavapath]-h|-help - Display arguments.-n - Display final environment variables,arguments, and other diagnosticinformation. MATLAB is not run.-e - Display ALL the environment variables andtheir values to standard output. MATLABis not run. If the exit status is not0 on returnthen the variables and valuesmay not be correct.v=variant - Start the version of MATLAB foundin bin/glnxa64/variant instead of bin/glnxa64.-c licensefile - Set location of the license file that MATLABshould use. It can have the form port@host orbe a colon separated list of license files.The LM_LICENSE_FILE and MLM_LICENSE_FILEenvironment variables will be ignored.-display Xdisplay - Send X commands to X server display, Xdisplay.Linux only.-nodisplay - Do not display any X commands. The MATLABdesktop will not be started. However, unless-nojvm is also provided the Java virtual machinewill be started.-noFigureWindows - Disables the display of figure windows in MATLAB.-nosplash - Do not display the splash screen during startup.-softwareopengl - Force MATLAB to start with software OpenGLlibraries. Not available on macOS.-nosoftwareopengl - Disable auto-selection of software OpenGLwhen a graphics driver with known issues is detected.Not available on macOS.-debug - Provide debugging information especially for Xbased problems. Linux only.-desktop - Allow the MATLAB desktop to be started by aprocess without a controlling terminal. This isusually a required command line argument whenattempting to start MATLAB from a window managermenu or desktop icon.-nodesktop - Do not start the MATLAB desktop. Use the currentterminal for commands. The Java virtual machinewill be started.-singleCompThread - Limit MATLAB to a single computational thread. By default, MATLAB makes use of the multithreading capabilities of the computer on which it is running.-nojvm - Shut off all Java support by not starting theJava virtual machine. In particular the MATLABdesktop will not be started.-jdb [port] - Enable remote Java debugging on port (default 4444)-batch MATLAB_command - Start MATLAB and execute the MATLAB command(s) with no desktopand certain interactive capabilities disabled. Terminatesupon successful completion of the command and returns exitcode 0. Upon failure, MATLAB terminates with a non-zero exit.Cannot be combined with -r.-r MATLAB_command - Start MATLAB and execute the MATLAB_command.Cannot be combined with -batch.-sd folder - Set the MATLAB startup folder to folder, specified as a string.Cannot be combined with -useStartupFolderPref.-useStartupFolderPref - Set the MATLAB startup folder to the valuespecified by the Initial working folder optionin the General Preferences panel.Cannot be combined with -sd.-logfile log - Make a copy of any output to the command windowinfile log. This includes all crash reports.-Ddebugger [options] - Start debugger to debug MATLAB.-nouserjavapath - Ignore custom javaclasspath.txt and javalibrarypath.txt files.
matlab -display Xdisplay
MATLAB is selecting SOFTWARE OPENGL rendering.< M A T L A B (R)>Copyright 1984-2021 The MathWorks, Inc.R2021a (9.10.0.1602886)64-bit (glnxa64)February 17, 2021To get started, type doc.
For product information, visit www.mathworks.com.>>
3.3 StaMPS
StaMPS is a software package that allows to extract ground displacements from time series of synthetic aperture radar (SAR) acquisitions. The package incorporates persistent scatterer and small baseline methods plus an option to combine both approaches. It is compatible with the TRAIN software and therefore allows to incorporate various tropospheric correction methods in the processing workflow.
StaMPS(Stanford Method for Persistent Scatterers)软件可以从SAR时序数据(ISCE, SNAP, GAMMA, and ROI PAC and DORIS等软件通过对SLC数据预处理可得到)中提取地面位移。
The TOPSAR Split operator provides a convenient way to split each subswath with selected bursts into a separate product. This operator is the first processing step in the TOPS InSAR processing chain.
The user may select the desired subswath with desired bursts and polarisations.
4.1.2. Apply Orbit File
The orbit state vectors provided in the metadata of a SAR product are generally not accurate and can be refined with the precise orbit files which are available days-to-weeks after the generation of the product.
The orbit file provides accurate satellite position and velocity information. Based on this information, the orbit state vectors in the abstract metadata of the product are updated.
4.1.3. InSAR Stack Overview
This function gives a general information about the interferometric stack. The information about the acquisition date, sensor, mode, as well as information about perpendicular and temporal baselines are being listed. Also an estimate for the modeled (expected) coherence is being computed, and used in selection of the optimal reference image for the InSAR stack.
The reference image is selected such that the dispersion of the perpendicular baseline is as low as possible. The reference image is selected maximizing the (expected) stack coherence of the interferometric stack. The “optimal” reference implies improved visual interpretation of the interferograms and aids quality assessment.
4.1.4. Sentinel-1 Back Geocoding
This operator co-registers two S-1 SLC split products (reference and secondary) of the same sub-swath using the orbits of the two products and a Digital Elevation Model (DEM).
In resampling the secondary images into reference frame, deramp and demodulation are performed first to the secondary image, then the truncated-sinc interpolation is performed. Finally, the reramp and remodulation are applied to the interpolated secondary image.
4.1.5. Sentinel-1 TOPSAR Deburst and Merge
For the TOPSAR IW and EW SLC products, each product consists of one image per swath per polarization. IW products have 3 swaths and EW have 5 swaths. Each sub-swath image consists of a series of bursts, where each burst was processed as a separate SLC image. The individually focused complex burst images are included, in azimuth-time order, into a single subswath image, with black-fill demarcation in between, similar to the ENVISAT ASAR Wide ScanSAR SLC products.
For IW, a focused burst has a duration of 2.75 sec and a burst overlap of ~50-100 samples. For EW, a focused burst has a duration of 3.19 sec. Overlap increases in range within a sub- swath.
Images for all bursts in all sub-swaths of an IW SLC product are re-sampled to a common pixel spacing grid in range and azimuth. Burst synchronisation is ensured for both IW and EW products.
Unlike ASAR WSS which contains large overlap between beams, for S-1 TOPSAR, the imaged ground area of adjacent bursts will only marginally overlap in azimuth just enough to provide contiguous coverage of the ground. This is due to the one natural azimuth look inherent in the data.
For GRD products, the bursts are concatenated and sub-swaths are merged to form one image. Bursts overlap minimally in azimuth and sub-swaths overlap minimally in range. Bursts for all beams have been resampled to a common grid during azimuth post-processing.
In the range direction, for each line in all sub-swaths with the same time tag, merge adjacent sub-swaths. For the overlapping region in range, merging is done midway between subswaths.
In the azimuth direction, bursts are merged according to their zero Doppler time. Note that the black-fill demarcation is not distinctly zero at the end or start of the burst. Due to resampling, the data fades into zero and out. The merge time is determined by the average of the last line of the first burst and the first line of the next burst. For each range cell, the merging time is quantised to the nearest output azimuth cell to eliminate any fading to zero data.
4.1.6. Interferogram formation (InSAR operator)
This operator computes (complex) interferogram, with or without subtraction of the flat-earth (reference) phase. The reference phase is subtracted using a 2d-polynomial that is also estimated in this operator.
If the orbits for interferometric pair are known, the flat-earth phase is estimated using the orbital and metadata information and subtracted from the complex interferogram. The flat-earth phase is the phase present in the interferometric signal due to the curvature of the reference surface. The geometric reference system of the reference surface is defined by the reference system of satellite orbits (for now only WGS84 supported, which the reference system used by all space-borne SAR systems).
The flat-earth phase is computed in a number of points distributed over the total image, after which a 2d-polynomial is estimated (using least squares) fitting these ‘observations’, (e.g. plane can be fitted by setting the degree to 1.)
A polynomial of degree 5 normally is sufficient to model the reference phase for a full SAR scene (approx 100x100km). While, a lower degree might be selected for smaller images, and higher degree for ‘long-swath’ scenes. Note that the higher order terms of the flat-earth polynomial are usually small, because the polynomial describes a smooth, long wave body (ellipsoid). To recommended polynomial degree, that should ensure the smooth surface for most image sizes and areas of the world is 5th degree.
In order to reduce the noise, as the post-processing step, you can perform multilooking (with Multilook Operator). Multilooking has to be performed separately on ‘virtual’ bands phase or intensity. In future releases complex Multilook operator will be released. Note that in case of ESA’s ERS and Envisat sensors, the factor 5:1 (azimuth:range) or similar ratio between the factors is chosen to obtain approximately square pixels (20x20 m^2 for factors 5 and 1). Of course the resolution decreases if multilooking is applied
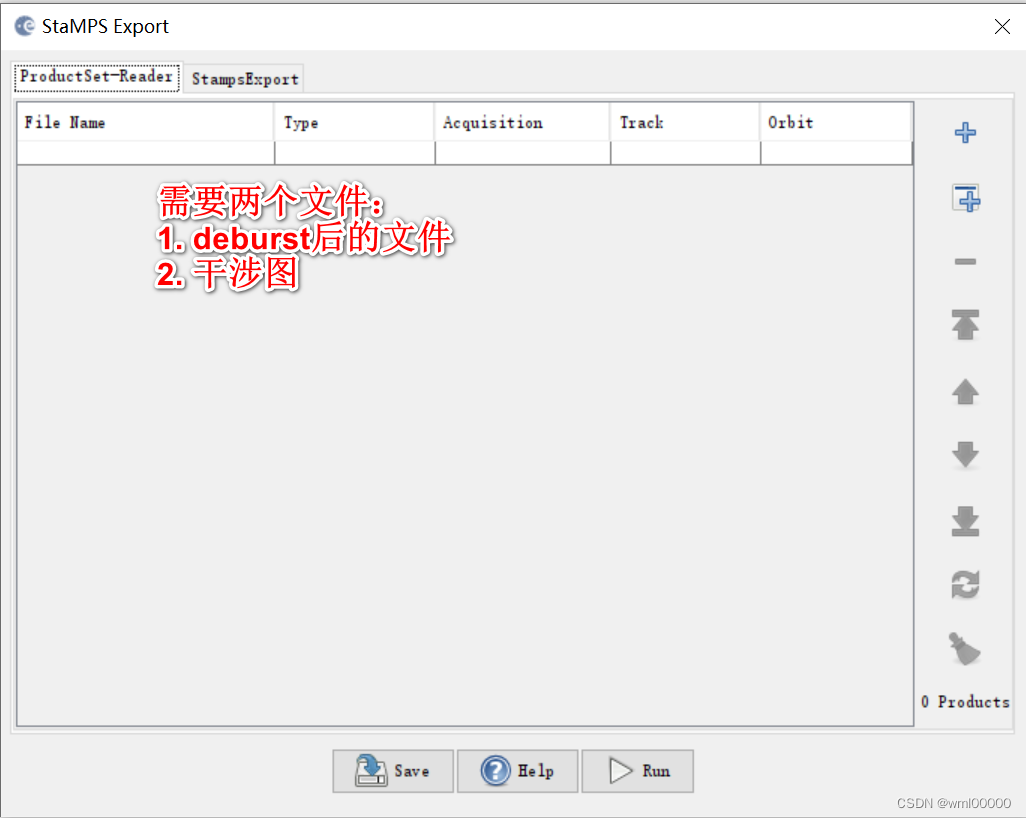
4.1.7. StaMPS Export
Use the StaMPS Export to produce data that can be used within the StaMPS applicaiton for Persistent Scattering Interferometry (PSI).
0.4 = amplitude dispersion (0.4-0.42 are reasonable values)
3 = number of patches in range (default 1)
2 = number of patches in azimuth, (default 1)
50 = overlapping pixels between patches in range (default 50)
200 = overlapping pixels between patches in azimuth (default 200)
The number of patches you choose will depend on the size of your area and the memory on your
computer. Generally, patches containing < 5 million SLC pixels are OK.