vue echarts 图形附带2种不同格式地图json
在vue项目中简单封装了几种echart图形 柱状图 饼图 词云 吉林省地图
graph.js中引入echarts
import echarts from 'echarts'main.js
import echart from 'utils/graph'
import ElementUI from 'element-ui'
import 'element-ui/lib/theme-chalk/index.css'
Vue.use(ElementUI)
Vue.prototype.$http = axios
Vue.prototype.$echart = echart
Vue.config.productionTip = false
注意事项:
1,如果echarts 绘制的时候div为隐藏状态 会出现canvas width:300px height 150px的情况 出现这种情况重新绘制一下就可以了,
setTimeout(() => {this.topChartList[flag].lineBar.resize()})2, 更新每次查询的数据 可以先使用getOption()获取 然后再重新设置data
let newO = this.mapE.getOption()newO.series[0].data = this.newMapListthis.mapE.setOption(newO)1. 带折线柱状图 pxtoVh为页面适配的像素
initLineBar(dom, pxToVh, dataList, time) {let lData = [time]if (!dataList.yd2.length == 0) {lData.push('增长率')}let myChart = echarts.init(dom)let option = {grid: {left: '8%',right: '6%',top: '10%',bottom: '10%'},title: {show: false},tooltip: {trigger: 'axis',axisPointer: {// 坐标轴指示器,坐标轴触发有效type: 'shadow' // 默认为直线,可选为:'line' | 'shadow'}},legend: {data: lData,right: '3%',top: '0',itemWidth: pxToVh * 0.81,itemHeight: pxToVh * 0.81,textStyle: {color: '#5A6271',fontSize: pxToVh * 0.88}},toolbox: {show: false},xAxis: [{type: 'category',boundaryGap: true,show: true,axisTick: {show: false},axisLabel: {fontSize: pxToVh * 0.81,color: '#5A6271',margin: 8,interval: 0,data: dataList.xd},axisLine: {lineStyle: {type: 'solid',color: '#EAEAEC', //左边线的颜色width: '1' //坐标线的宽度}},data: dataList.xd}],yAxis: [{type: 'value',scale: true,name: '',axisLine: {show: false},splitNum: 6,axisTick: {show: false},splitLine: {lineStyle: {color: '#EAEAEC'}},axisLabel: {fontSize: pxToVh * 0.81,color: '#5A6271',margin: 12},min: 0,boundaryGap: [0.2, 0.2]},{type: 'value',scale: true,axisLine: {show: false},splitNum: 6,axisTick: {show: false},axisLabel: {fontSize: pxToVh * 0.81,color: '#5A6271',margin: 12,formatter: '{value} %'},splitLine: {show: false,lineStyle: {// 使用深浅的间隔色color: '#EAEAEC'}},name: '',// max: 30,// min: 0,boundaryGap: [0.2, 0.2]}],series: [{name: lData[0],type: 'bar',label: {normal: {show: true,position: 'top',textStyle: {color: '#FFFFFF'},fontSize: pxToVh * 0.81,padding: [0, pxToVh * 0.51],backgroundColor: {image: '/static/img/tooltip_num_bg.png'},formatter: function(params) {for (var i = 0, l = option.xAxis[0].data.length; i < l; i++) {if (option.xAxis[0].data[i] == params.name) {// var val1 = params.value || 0let val2 = option.series[0].data[i] || 0return `{a|${val2}}`}}},rich: {a: {height: pxToVh * 2.01,color: '#fff'}}}},itemStyle: {normal: {zlevel: 2,color: new echarts.graphic.LinearGradient(0,1,0,0,[{offset: 0,color: '#78B0CF'// 0% 处的颜色},{offset: 1,// 100% 处的颜色color: '#92DCF3'}],false)}},barWidth: pxToVh * 1.54,yAxisIndex: 0,data: dataList.yd1},{name: '增长率',yAxisIndex: 1,symbol: 'circle',symbolSize: pxToVh * 0.59,smooth: true,color: '#FA8C16',label: {normal: {show: false,position: 'top',textStyle: {color: '#FA8C16'}}},lineStyle: {color: '#FA8C16'},type: 'line',data: dataList.yd2}]}myChart.setOption(option)return myChart},页面调用
initLineBar(refId, list, time) {let refI = refId ? refId : 'lineBar'let reff = this.$refs[refI]if (reff) {console.log(list)return this.$echart.initLineBar(reff[0], this.pxTovh, list, time)}},数据格式
this.lineBarTotal = {yd1: [10758,3975,2980,1831,2122,3018,3525,1729,2764,380,3988,2333,3596,453,365],yd2: [28, 4.4, 5.9, 0.9, 0.7, 1.1, 2.1, 0.4, 1.9, 3.8, 1.6],xd: ['省本级','长春市','吉林市','四平市','辽源市','通化市','白山市','松原市','白城市','延边市','长白山管委会']}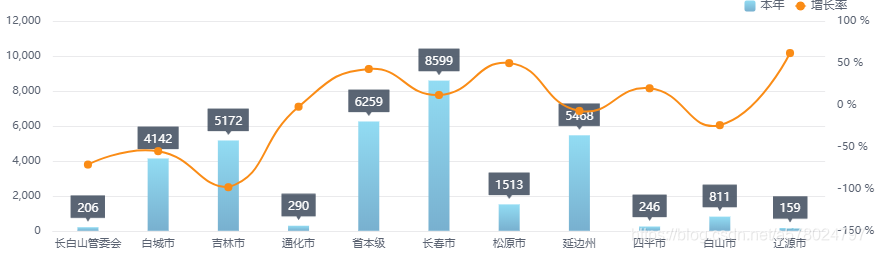
2. 饼图 可以设置每一项的最小角度 防止字体重叠
  initPie(dom, pxToVh, dataList) {let myChart = echarts.init(dom)let option = {tooltip: {trigger: 'item',formatter: '{a}
{b}: {c} ({d}%)'},//最小的扇区角度(0 ~ 360),用于防止某个值过小导致扇区太小影响交互avoidLabelOverlap: true,color: ['#073E67','#074879','#0F5081','#07548C','#2671A5','#2671A5','#A0EAFF','#74DFFF','#56CDF0','#56CDF0','#3FACF7'],series: [{name: '主题分布',type: 'pie',radius: ['20%', '45%'],minAngle: 10,startAngle: 90,label: {normal: {show: true,formatter: '{b}',fontSize: pxToVh * 0.81,color: '#7D8B9B'//, '{b|{d}% {c}件}'// formatter: ['{a|{b}}'].join('\n'),// rich: {//   a: {//     color: '#7D8B9B',//     fontSize: pxToVh * 0.81//   }//   // b: {//   //   color: '#394351',//   //   fontSize: pxToVh * 0.81//   // }// }},emphasis: {show: true}},labelLine: {normal: {show: true,lineStyle: {color: '#75C8F6'}}},data: dataList}]}myChart.setOption(option)return myChart},
页面调用
initPie(refId, list) {let refI = refId ? refId : 'pie'let reff = this.$refs[refI]if (reff) {return this.$echart.initPie(reff[0], this.pxTovh, list)}},数据格式
this.pieTotal = [{ value: 335, name: '直接访问' },{ value: 310, name: '邮件营销' },{ value: 234, name: '联盟广告' },{ value: 135, name: '视频广告' },{ value: 1548, name: '搜索引擎' },{ value: 335, name: '直接访问2' },{ value: 310, name: '邮件营销2' },{ value: 234, name: '联盟广告2' },{ value: 135, name: '视频广告2' },{ value: 1548, name: '搜索引擎2' }]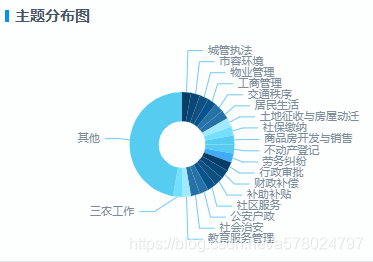
3. 词云 词云需要先单独引用一下 require('echarts-wordcloud')
initWorldCloud(dom, pxToVh, dataList) {console.log(pxToVh, dataList)let chart = echarts.init(dom)chart.setOption({tooltip: { show: false },series: [{type: 'wordCloud',gridSize: pxToVh * 0.88,sizeRange: [pxToVh * 0.88, pxToVh * 2.2],rotationRange: [0, 0],shape: 'rectangle',width: '100%',height: '100%',drawOutOfBound: true,textStyle: {normal: {color: function() {return ['#B3B5B6', '#404448'][Math.round(Math.random())]}}},data: dataList}]})return chart},页面调用
initWorldCloud(refId, list) {let refI = refId ? refId : 'wordCloud'let reff = this.$refs[refI]if (reff) {return this.$echart.initWorldCloud(reff[0], this.pxTovh, list)}},数据结构
this.wordCloud = [{name: '物业管理',value: 10000},{name: '占道停车',value: 6181},{name: '公交车、出租车管理',value: 4386},{name: '油烟扰民',value: 4055},{name: '扬尘污染',value: 2467},{name: '道路、桥梁、隔离栏的维护',value: 2244},{name: '噪声分贝测试',value: 1898},{name: '违章搭建',value: 1484},{name: '环境卫生综合整治',value: 1112}]
4.地图
我这里做的是吉林省地图, 地图需要先引入json 这里可以直接引入 echart自带的json 但是可能并不满足自己的需求, 那么可以引入自己的json 。 使用了两种格式json都可以显示出来图形, 第一种为外层带id(实际就是地区的areacode) 第二种再里层写的, 如果后台接口返回的市级名称跟json中对不上 , 那么可以修改json文件的name 跟后台接口对应上了就可。
"properties": {"adcode": "220600","center": { "lat": 41.942505, "lng": 126.427839 },"cp": [126.784728, 41.939629],"level": "city","name": "白山市","parent": {"adcode": "220000","center": {"coordinates": [125.3245, 43.886841],"crs": {"properties": { "name": "urn:ogc:def:crs:EPSG:6.3:4326" },"type": "name"},"type": "Point"},"level": "province","name": "吉林省"},"telecode": "0439"},代码与数据结构
import 'echarts/map/js/province/jilin.js'
// import obj2 from 'echarts/map/json/province/jilin.json'
// console.log(obj2)
const nameP = 'jilin'
import obj from 'json/myjilin.json'
console.log(obj)
// console.log(JSON.stringify(obj2.features[2]))
echarts.registerMap(nameP, obj)
initMap(dom, pxToVh, dataList) {console.log(dataList)let myChart = echarts.init(dom)let option = {tooltip: {trigger: 'item',formatter: function(params) {return params.name + '案件数 : ' + params.value}},visualMap: {min: 0,max: 999999999,left: 'left',top: 'bottom',showLabel: !0,show: !0,pieces: [{ min: 1000, color: '#BF242A', label: '>1000' },{ min: 501, max: 1000, color: '#CD5459', label: '501-1000' },{ min: 301, max: 500, color: '#DC878A', label: '301-500' },{ min: 101, max: 300, color: '#EAB7B9', label: '101-300' },{ min: 0, max: 100, color: '#F3D7D9', label: '0-100' }]// color: ['#eeeeee', '#db7037']},series: [{type: 'map',map: nameP,label: {normal: {show: true}},emphasis: {color: 'auto'},aspectScale: 1,zoom: 1.2,data: dataList// data: [// {// name: '长春市',// value: 0// },// {// name: '吉林市',// value: 0// },// {// name: '长白山管委会',// value: 0// },// {// name: '白城市',// value: 0// },// {// name: '松原市',// value: 0// },// {// name: '延边州',// value: 0// },// {// name: '四平市',// value: 0// },// {// name: '白山市',// value: 0// },// {// name: '辽源市',// value: 0// },// {// name: '通化市',// value: 0// },// {// name: '省本级',// value: 0// }// ]}]}myChart.setOption(option)return myChart}页面调用
if (this.mapE) {console.log(this.mapE.getOption(), 'option')let newO = this.mapE.getOption()console.log(this.newMapList)newO.series[0].data = this.newMapListthis.mapE.setOption(newO)} else {this.mapE = this.initMap('map', this.pxTovh, this.newMapList)}initMap(refId, list) {let refI = refId ? refId : 'map'let reff = this.$refs[refI]if (reff) {return this.$echart.initMap(reff, this.pxTovh, list)}},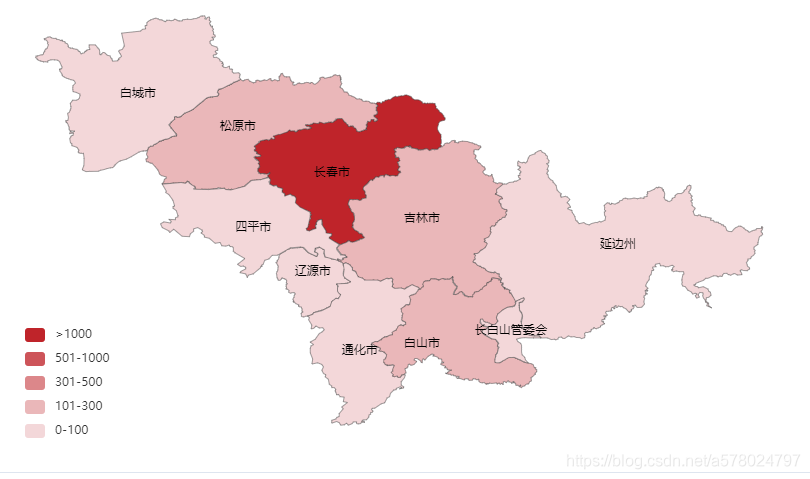
外层带id 格式json https://download.csdn.net/download/a578024797/12507048
{"id": "220500","properties": {"cp": [125.936501, 41.721177],"name": "通化市","childNum": 1}
}
内层带id 格式json https://download.csdn.net/download/a578024797/12507230
两种格式主要差别在geometry.coordinates
一种是"@@GDC@GDCAKFGAGEMCGECEBECE]E@EAGBGEE@IIKMC@CBGI@GG@CFG@EBI@
另一种[123.3325,44.0662],[ 123.5852,44.0881], [ 123.6401,44.0771 ], 两种格式不能混用 否则图形显示不出来
{"type": "Feature","properties": {"id": "2203","name": "四平市","cp": [124.541,43.4894],"childNum": 5},
}
文章内 吉林省json https://download.csdn.net/download/a578024797/12507279
本文来自互联网用户投稿,文章观点仅代表作者本人,不代表本站立场,不承担相关法律责任。如若转载,请注明出处。 如若内容造成侵权/违法违规/事实不符,请点击【内容举报】进行投诉反馈!