//引入echarts依赖
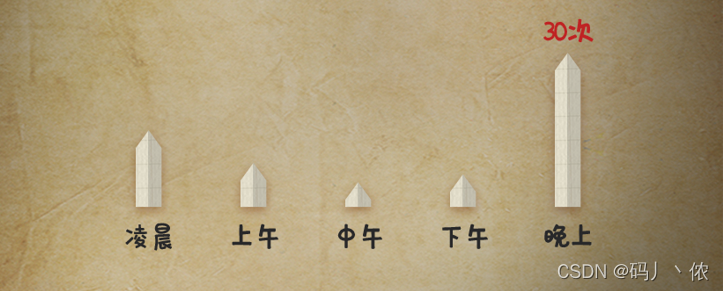
import { LineChart, BarChart,PictorialBarChart } from 'echarts/charts';data() {return {labelData: ["凌晨", "上午", "中午", "下午", "晚上"],};},async mounted() {await this.receiveRights(); //财富值查询},
methods: {receiveRights() {if (this.$refs.wealBar) {this.myChartBar = this.$echarts.init(this.$refs.wealBar);let option;let yData = [12,43,555,33,21];let barWidth = 14;option = {grid: {top: "24%",left: "8%",bottom: "2%",right: "8%",containLabel: true,},animation: false,xAxis: {type: "category",axisTick: {// x轴刻度线show: false,},axisLine: {lineStyle: {color: "#27272E",width: 0, //x轴 是否显示type: "dotted", //'dotted'虚线 'solid'实线},},// x轴的字体样式axisLabel: {show: true,textStyle: {color: "#27272E",fontFamily: "zihun107",fontSize: 12,},},data: this.labelData,},yAxis: {//修改y轴间距type: "value",min: 0,max: function (value) {//取最大值向上取整为最大刻度return Math.ceil(value.max) + 10;},scale: true, //自适应minInterval: function (value) {//分割刻度return Math.ceil(value.max / 10);},axisTick: {// y轴刻度线show: false,},splitLine: {// 网格线show: false,},splitArea: { show: false }, // 保留网格区域axisLabel: {show: false,textStyle: {color: "#87878E",},// 这里重新定义就可以formatter: function (value) {return `${value}`;},textStyle: {color: "#87878E",fontSize: "16",},},},series: [{name: "顶部三角",type: "pictorialBar",symbol: "triangle",symbolSize: [barWidth, 10],symbolOffset: [0, -10],symbolPosition: "end",z: 12,label: {normal: {show: true ,position: "top",//数值样式fontFamily: "zihun107",color: "#bf2323",fontSize: 12,//顶部数据展示,目前只展示最大值formatter: function (params) {let maxIndex = 0;for (const i in yData) {maxIndex = Number(yData[i])>Number(yData[maxIndex])?i:maxIndex}return params.dataIndex==maxIndex?params.value + "次":"";},},},color: new this.$echarts.graphic.LinearGradient(1, 1, 0, 1, [{ offset: 0, color: "#ceccc9" },{ offset: 0.5, color: "#969799" },{ offset: 0.5, color: "#b1adad" },{ offset: 1, color: "#ece4d2" },]),data: yData,},{type: "bar",barWidth: barWidth,barGap: "10%", // Make series be overlapbarCateGoryGap: "10%",markPoint: {data: [{type: 'max',name: '最大值'}, {type: 'min',name: '最小值'}]},itemStyle: {normal: {color: new this.$echarts.graphic.LinearGradient(1, 1, 0, 1, [{ offset: 0, color: "#ceccc9" },{ offset: 0.5, color: "#969799" },{ offset: 0.5, color: "#b1adad" },{ offset: 1, color: "#ece4d2" },]),},},data: yData,},],};this.myChartBar.setOption(option);}},},
};//备注:如添加了外部字体等元素时,渲染时可能会出现加载不出外部字体的情况
//处理方式:渲染时先去加载字体文件document.fonts.ready.then(function() {that.myChartBar = that.$echarts.init(that.$refs.wealBar);that.myChartBar.resize();});
本文来自互联网用户投稿,文章观点仅代表作者本人,不代表本站立场,不承担相关法律责任。如若转载,请注明出处。 如若内容造成侵权/违法违规/事实不符,请点击【内容举报】进行投诉反馈!
