matplotlib绘制出光滑曲线
用matplotlib库绘制光滑的曲线图
注意点:坐标要是用range()表示的话用这个方法拟合平滑曲线会报错,查了别人说的把range()转化成list(range())感觉并没有用,所以还是用了穷举法表示的x坐标。
import numpy as np
import matplotlib.pyplot as plt
from scipy.interpolate import make_interp_spline, interp1d
from tensorflow.python.keras.metrics import Reduce#plot double lines
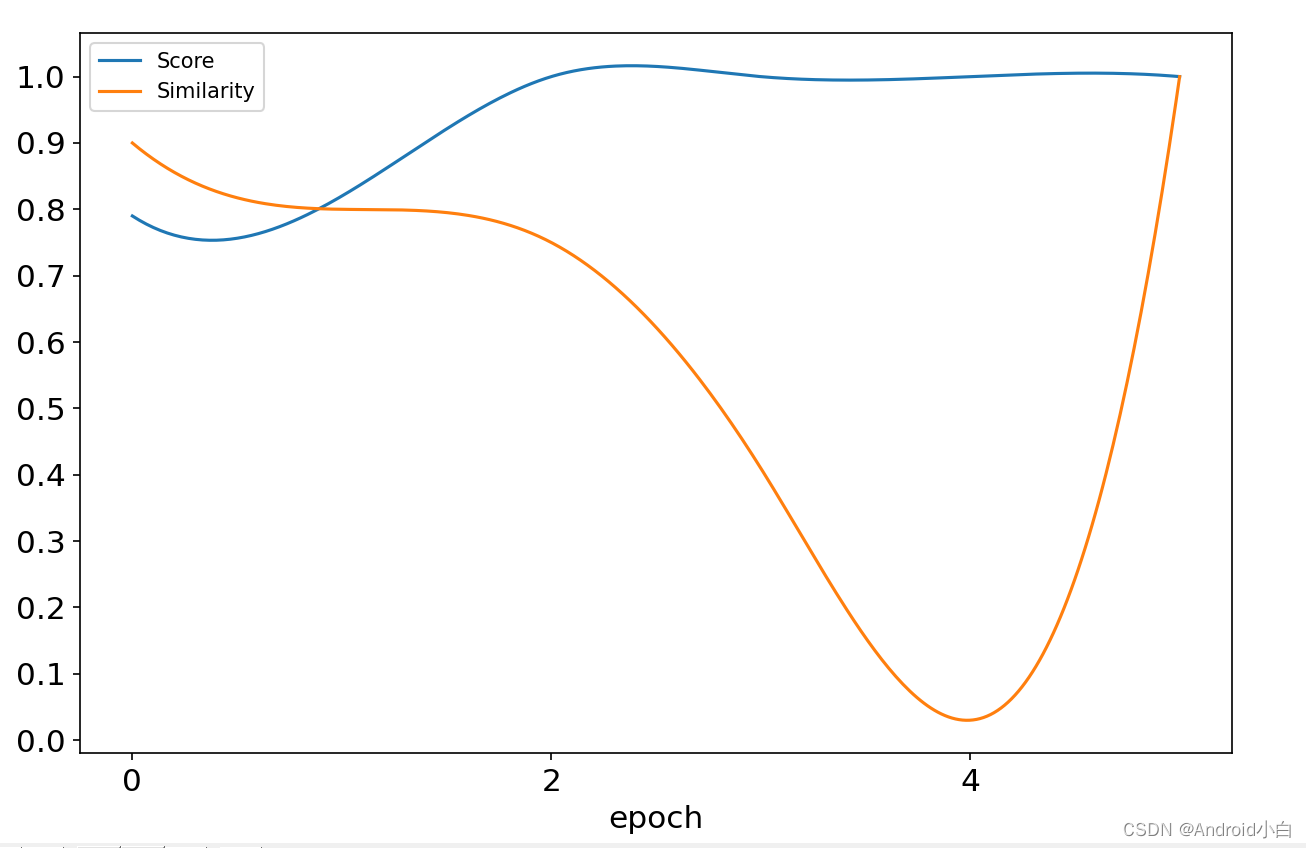
def plot_double_lines(n, x, y1, y2, pic_name):# initialize plot parametersprint('picture name: %s, len of data: %d' % (pic_name, n))plt.rcParams['figure.figsize'] = (6 * 8 / 5, 6)plt.subplots_adjust(left=0.1, right=0.9, top=0.9, bottom=0.1)plt.xticks(np.arange(0,10,2),size=15)plt.yticks(np.arange(0,1.1,0.1),size=15)plt.xlabel("epoch", fontsize=15)# plt.ylabel("acc", fontsize=15)# plot curve 1plt.plot(x, y1, label='Score')# plot curve 2plt.plot(x, y2, label='Similarity')# show the legendplt.legend()# show the pictureplt.show()if __name__ == '__main__':xs = np.array([0,1,2,3,4,5])y1s = np.array([0.79, 0.82, 1, 1,1,1])y2s = np.array([0.9, 0.8, 0.75, 0.41, 0.03,1])xnew = np.linspace(xs.min(), xs.max(), 300)func = interp1d(xs, y1s, kind='cubic')func2 = interp1d(xs, y2s, kind='cubic')ynew = func(xnew)ynew2 = func2(xnew)plot_double_lines(51, xnew, ynew, ynew2, 'Two Curves')本文来自互联网用户投稿,文章观点仅代表作者本人,不代表本站立场,不承担相关法律责任。如若转载,请注明出处。 如若内容造成侵权/违法违规/事实不符,请点击【内容举报】进行投诉反馈!