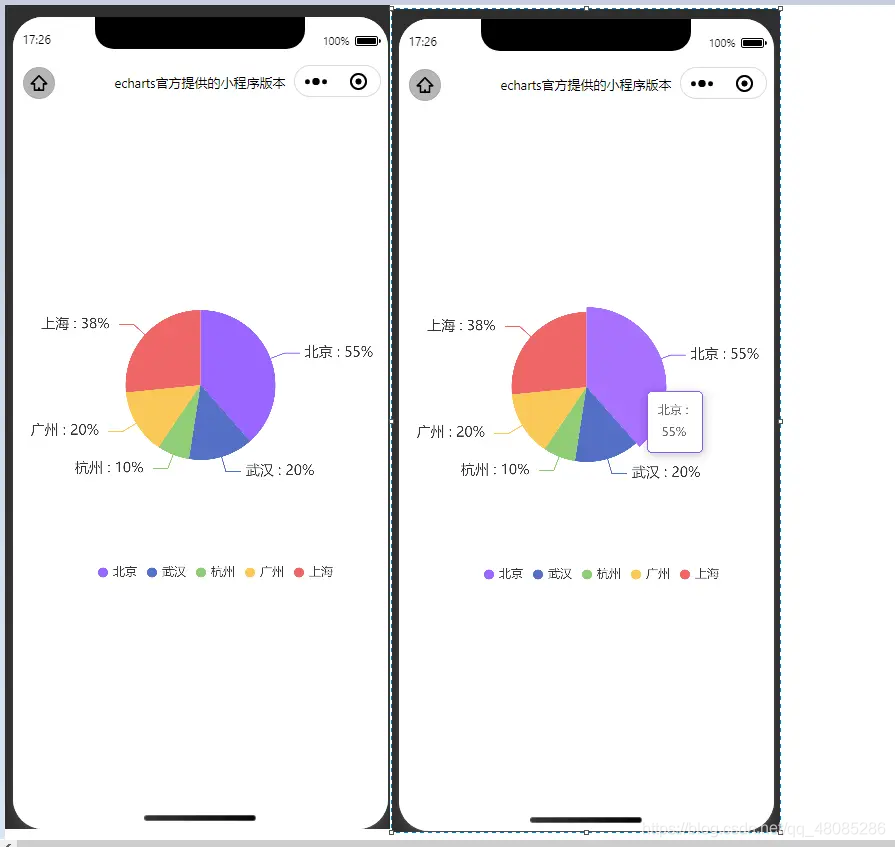
echarts官方提供的小程序版本
1.实现效果
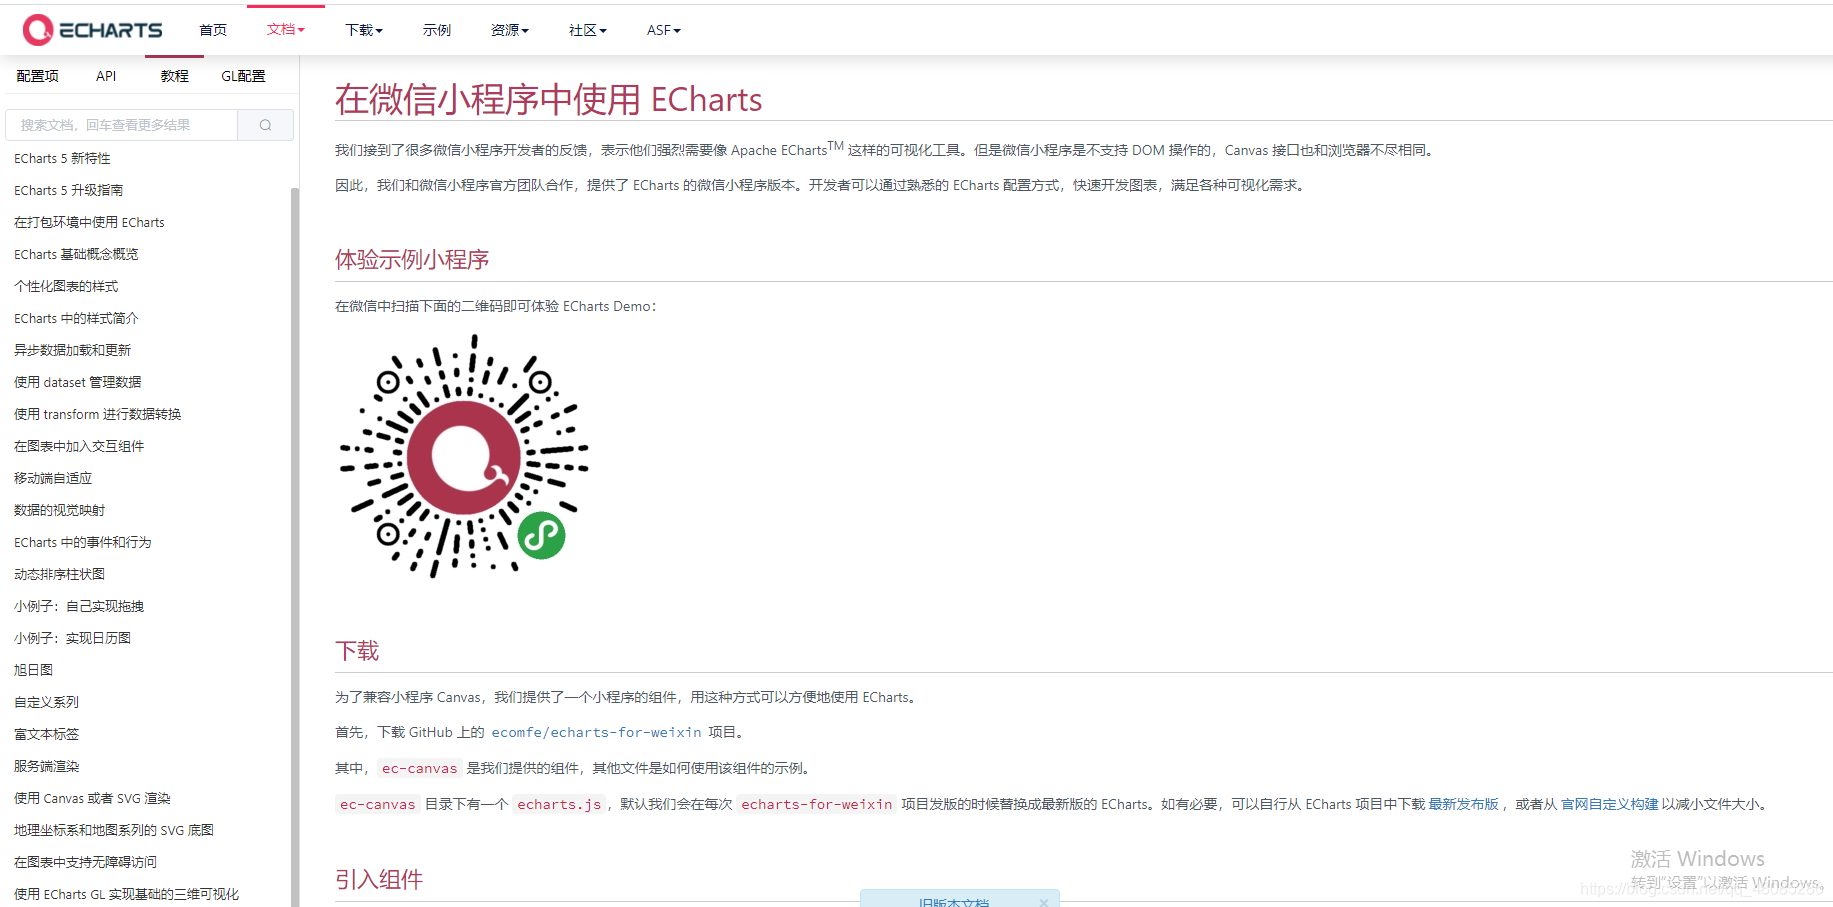
2.echarts官网
echarts
3.步骤
(1):引用组件
{"navigationBarTitleText": "echarts官方提供的小程序版本","usingComponents": {"ec-canvas": "../../components/ec-canvas/ec-canvas"}
}
(2):几个重点
legend:设置显示的标签
tooltip:是否显示弹框
formatter中的a,b,c,d等参数的意义:
其中变量a、b、c在不同图表类型下代表数据含义为:
- 折线(区域)图、柱状(条形)图: a(系列名称),b(类目值),c(数值), d(无)
- 散点图(气泡)图 : a(系列名称),b(数据名称),c(数值数组), d(无)
- 饼图、雷达图 : a(系列名称),b(数据项名称),c(数值), d(百分比)
- 弦图 : a(系列名称),b(项1名称),c(项1-项2值),d(项2名称), e(项2-项1值)
- 力导向图 :节点 : a(类目名称),b(节点名称),c(节点值)
- 边 : a(系列名称),b(源名称-目标名称),c(边权重), d(如果为true的话则数据来源是边)
{Function},传递参数列表如下:
params : 数组内容同模板变量,[[a, b, c, d], [a1, b1, c1, d1], …]
ticket : 异步回调标识
callback : 异步回调,回调时需要两个参数,第一个为前面提到的ticket,第二个为填充内容html
(3)必须为ec-canvas的上一个view节点设置高度!!!!否则不显示
4.完整代码(更多代码请移步码云)
https://gitee.com/susuhhhhhh/wxmini_demo
5.部分代码
/* pages/charts/index.wxss */
page{background-color: #fff;
}
.con{height: 800rpx;margin: 80px auto;position: relative;
}
.container{position: absolute;top: 0;bottom: 0;left: 0;right: 0;
}.ec-canvas {width: 100%;height: 100%;
}
import * as echarts from '../../components/ec-canvas/echarts';
const app = getApp();function initChart(canvas, width, height, dpr) {const chart = echarts.init(canvas, null, {width: width,height: height,devicePixelRatio: dpr // new});canvas.setChart(chart);var option = {backgroundColor: "#fff",legend: {type: 'scroll',show:true,// orient: 'vertical',right: 50,bottom: 0,icon: "circle", itemWidth: 10,  // 设置宽度itemHeight: 10, // 设置高度},tooltip: {show: true,trigger: 'item',formatter: "{b} : \n {c}% "  },series: [{label: {normal: {formatter: "{b} : {c}% "  ,fontSize: 14}},type: 'pie',center: ['50%', '50%'],radius: ['0%', '40%'],data: [{value: 55,name: '北京',itemStyle: {color: '#9966ff'}}, {value: 20,name: '武汉'}, {value: 10,name: '杭州'}, {value: 20,name: '广州'}, {value: 38,name: '上海'}],// itemStyle: {//   normal: {//     label: {//       show: true,//       position: 'inner',//       formatter: "{d}%"//     },//     labelLine: {//       show: false//     }//   },// },}]};chart.setOption(option);return chart;}Page({onShareAppMessage: function (res) {return {title: 'ECharts 可以在微信小程序中使用啦!',path: '/pages/index/index',success: function () { },fail: function () { }}},data: {ec: {onInit: initChart}},onReady() {}
});
本文来自互联网用户投稿,文章观点仅代表作者本人,不代表本站立场,不承担相关法律责任。如若转载,请注明出处。 如若内容造成侵权/违法违规/事实不符,请点击【内容举报】进行投诉反馈!