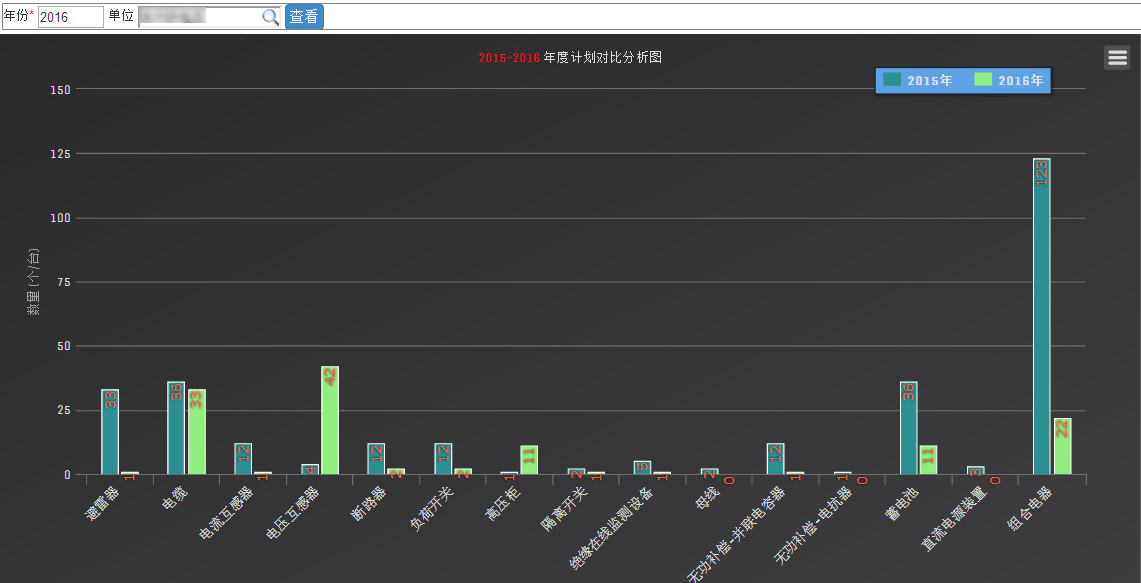
HCharts 柱状图分组效果 - 统计两年的设备数量对比
上图喽,铭记咱滴劳作。
核心代码:
**主题文件**
hcharts.js
/*** Dark theme for Highcharts JS* @author Torstein Honsi*/// Load the fonts
Highcharts.createElement('link', {href: 'http://fonts.googleapis.com/css?family=Unica+One',rel: 'stylesheet',type: 'text/css'
}, null, document.getElementsByTagName('head')[0]);Highcharts.theme = {colors: ["#2b908f", "#90ee7e", "#f45b5b", "#7798BF", "#aaeeee", "#ff0066", "#eeaaee","#55BF3B", "#DF5353", "#7798BF", "#aaeeee"],chart: {backgroundColor: {linearGradient: { x1: 0, y1: 0, x2: 1, y2: 1 },stops: [[0, '#2a2a2b'],[1, '#3e3e40']]},style: {fontFamily: "'Unica One', sans-serif"},plotBorderColor: '#606063'},title: {style: {color: '#E0E0E3',textTransform: 'uppercase',fontSize: '20px'}},subtitle: {style: {color: '#E0E0E3',textTransform: 'uppercase'}},xAxis: {gridLineColor: '#707073',labels: {style: {color: '#E0E0E3'}},lineColor: '#707073',minorGridLineColor: '#505053',tickColor: '#707073',title: {style: {color: '#A0A0A3'}}},yAxis: {gridLineColor: '#707073',labels: {style: {color: '#E0E0E3'}},lineColor: '#707073',minorGridLineColor: '#505053',tickColor: '#707073',tickWidth: 1,title: {style: {color: '#A0A0A3'}}},tooltip: {backgroundColor: 'rgba(0, 0, 0, 0.85)',style: {color: '#F0F0F0'}},plotOptions: {series: {dataLabels: {color: '#B0B0B3'},marker: {lineColor: '#333'}},boxplot: {fillColor: '#505053'},candlestick: {lineColor: 'white'},errorbar: {color: 'white'}},legend: {itemStyle: {color: '#E0E0E3'},itemHoverStyle: {color: '#FFF'},itemHiddenStyle: {color: '#606063'}},credits: {style: {color: '#666'}},labels: {style: {color: '#707073'}},drilldown: {activeAxisLabelStyle: {color: '#F0F0F3'},activeDataLabelStyle: {color: '#F0F0F3'}},navigation: {buttonOptions: {symbolStroke: '#DDDDDD',theme: {fill: '#505053'}}},// scroll chartsrangeSelector: {buttonTheme: {fill: '#505053',stroke: '#000000',style: {color: '#CCC'},states: {hover: {fill: '#707073',stroke: '#000000',style: {color: 'white'}},select: {fill: '#000003',stroke: '#000000',style: {color: 'white'}}}},inputBoxBorderColor: '#505053',inputStyle: {backgroundColor: '#333',color: 'silver'},labelStyle: {color: 'silver'}},navigator: {handles: {backgroundColor: '#666',borderColor: '#AAA'},outlineColor: '#CCC',maskFill: 'rgba(255,255,255,0.1)',series: {color: '#7798BF',lineColor: '#A6C7ED'},xAxis: {gridLineColor: '#505053'}},scrollbar: {barBackgroundColor: '#808083',barBorderColor: '#808083',buttonArrowColor: '#CCC',buttonBackgroundColor: '#606063',buttonBorderColor: '#606063',rifleColor: '#FFF',trackBackgroundColor: '#404043',trackBorderColor: '#404043'},// special colors for some of thelegendBackgroundColor: 'rgba(0, 0, 0, 0.5)',background2: '#505053',dataLabelsColor: '#B0B0B3',textColor: '#FFD388',contrastTextColor: '#F0F0F3',maskColor: 'rgba(255,255,255,0.3)'
};// Apply the theme
Highcharts.setOptions(Highcharts.theme);
具体的实现模块
function hcharts(cate, data2015, data2016) {var year = [];year.push($("#<%=txtYear.ClientID %>").val());//今年year.push(((year[0] != null || year[0] != "") ? year[0] - 1 : ''));//去年$('#container').highcharts({chart: {type: 'column',margin: [50, 50, 100, 80]},title: {text: ''+year[1]+'-'+year[0]+' 年度计划对比分析图'},xAxis: {categories: cate,labels: {rotation: -45,align: 'right',style: {fontSize: '13px',fontFamily: 'Verdana, sans-serif'}}},yAxis: {min: 0,title: {text: '数量 (个/台)'},stackLabels: {enabled: true,style: {fontWeight: 'bold',color: (Highcharts.theme && Highcharts.theme.textColor) || 'gray'}}},legend: {align: 'right',x: -70,verticalAlign: 'top',y: 20,floating: true,backgroundColor: (Highcharts.theme && Highcharts.theme.legendBackgroundColorSolid) || '#5DA2E5',borderColor: '#1E1E1E',borderWidth: 1,shadow: true},tooltip: {pointFormat: '{series.name}总计划 {point.y} (个/台)',},series: [{name: year[1]+'年',data: data2015,dataLabels: {enabled: true,rotation: -90,color: 'tomato',align: 'right',x: 4,y: 1,style: {fontSize: '13px',fontFamily: 'Verdana, sans-serif',textShadow: '0 0 3px black'}}}, {name: year[0]+'年',data: data2016,dataLabels: {enabled: true,rotation: -90,color: 'tomato',align: 'right',x: 4,y: 1,style: {fontSize: '13px',fontFamily: 'Verdana, sans-serif',textShadow: '0 0 3px black'}}}]});}说到现在,那么你会问了,你这方法里面传进去的是什么东东阿?
ok,晒一下
cate = [‘避雷器’,’电缆’,….]
data2015 =[1,33…..]
data2016 =[33,36…..]
懂了吧?其实就是数组嘛
好了,希望对你也有帮助哦
本文来自互联网用户投稿,文章观点仅代表作者本人,不代表本站立场,不承担相关法律责任。如若转载,请注明出处。 如若内容造成侵权/违法违规/事实不符,请点击【内容举报】进行投诉反馈!