python matplotlib颜色表制作【自定义】
今日不想干活,研究一下颜色表的制作方法。仅为粗陋测试。
背景
-
matpltlib的颜色表数据在 _cm.py 文件里,具体种类如最下方的字典datad所示:
从1358行到1433行,应该是76个,包含单色系,双色系,离散等多种类别,具体见pyplot.colormaps()函数注释
-
另外注释有写
Documentation for each is in pyplot.colormaps().  Please update this
with the purpose and type of your colormap if you add data for one here.
所以要注意更改此函数
-
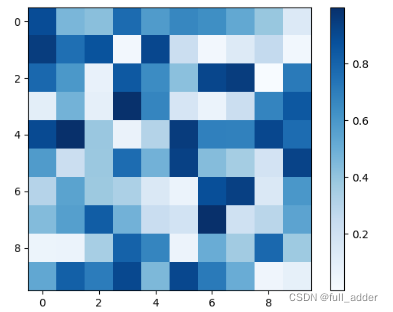
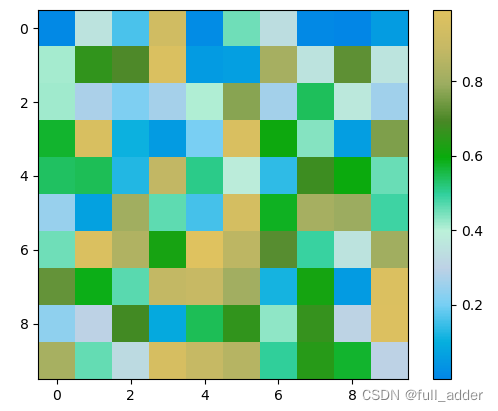
用于测试颜色表是否安插成功的绘图代码,这里来个混淆矩阵
def drawtry():metrics=np.random.random((10,10))plt.imshow(metrics, cmap=plt.cm.coolwarm)cbar = plt.colorbar()plt.show()
步骤
一. 做一个字典
- 首先我们观察颜色表字典的构建方法,选择单色颜色表Blues,其颜色如下
代码如下:

- 测试一:把前六行换了Green中的颜色:
- 测试二:在后方加上Purple里的五种颜色:

- 以上测试大致说明,只要改颜色表里信息就行,且条数没有限制。除此之外还有一些其它写法,
- 其生成区别在函数 _gen_cmap_registry()中
def _gen_cmap_registry():"""Generate a dict mapping standard colormap names to standard colormaps, aswell as the reversed colormaps."""cmap_d = {**cmaps_listed}for name, spec in datad.items():cmap_d[name] = ( # Precache the cmaps at a fixed lutsize..colors.LinearSegmentedColormap(name, spec, LUTSIZE)if 'red' in spec elsecolors.ListedColormap(spec['listed'], name)if 'listed' in spec elsecolors.LinearSegmentedColormap.from_list(name, spec, LUTSIZE))
- 比如autumn
_autumn_data = {'red': ((0., 1.0, 1.0), (1.0, 1.0, 1.0)),'green': ((0., 0., 0.), (1.0, 1.0, 1.0)),'blue': ((0., 0., 0.), (1.0, 0., 0.))}

-
又比如ocean用了函数
_ocean_data = {'red': gfunc[23],'green': gfunc[28],'blue': gfunc[3],
}

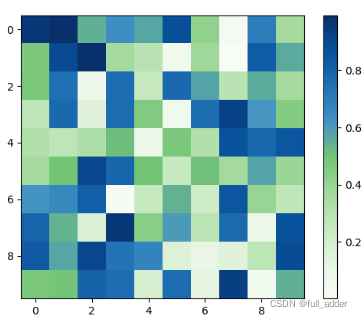
今日就打算做一个简单版本的,所以,直接用Blues的方法。就刚才的那个蓝紫绿拼接版吧,改一个名称叫PBG_PBG_data = ((0.96862745098039216, 0.9882352941176471 , 0.96078431372549022),(0.89803921568627454, 0.96078431372549022, 0.8784313725490196 ),(0.7803921568627451 , 0.9137254901960784 , 0.75294117647058822),(0.63137254901960782, 0.85098039215686272, 0.60784313725490191),(0.45490196078431372, 0.7686274509803922 , 0.46274509803921571),(0.25882352941176473, 0.5725490196078431 , 0.77647058823529413),(0.12941176470588237, 0.44313725490196076, 0.70980392156862748),(0.03137254901960784, 0.31764705882352939, 0.61176470588235299),(0.03137254901960784, 0.18823529411764706, 0.41960784313725491),(0.9882352941176471, 0.98431372549019602, 0.99215686274509807),(0.93725490196078431, 0.92941176470588238, 0.96078431372549022),(0.85490196078431369, 0.85490196078431369, 0.92156862745098034),(0.73725490196078436, 0.74117647058823533, 0.86274509803921573),(0.61960784313725492, 0.60392156862745094, 0.78431372549019607)) - 其生成区别在函数 _gen_cmap_registry()中
- 测试一:把前六行换了Green中的颜色:
- 加进字典,开心的话写个注释
'PBG':_PBG_data, - 测试
plt.imshow(metrics, cmap=plt.cm.PBG)
有点子简单,不够酷炫
二. 终极玛丽苏七彩版本
- 由于我们前期测试过括号的一致性,因此现在就可以瞎写.
- 二进制:
_ejz_data={'red': ((0., 0., 0.), (0.142857, 1., 1.),(0.284714, 0., 0.), (0.428571, 1., 1.),(0.571428, 0., 0.), (0.714285, 1., 1.),(0.857142, 0., 0.), (1., 1., 1.)),'green': ((0., 0., 0.), (0.142857, 0., 0.),(0.284714, 1., 1.), (0.428571, 1., 1.),(0.571428, 0., 0.), (0.714285, 0., 0.),(0.857142, 1., 1.), (1., 1., 1.)),'blue': ((0., 0., 0.), (0.142857, 0., 0.),(0.284714, 0., 0.), (0.428571, 0., 0.),(0.571428, 1., 1.), (0.714285, 1., 1.),(0.857142, 1., 1.), (1., 1., 1.))}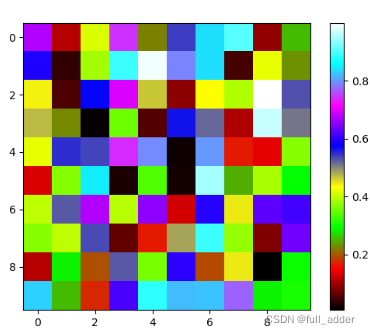
- 星空梵高【黑的太难看了没加】

- 千里江山图
参考
【1】matplotlib.pyplot——cmap直观理解_Lilies is here.-CSDN博客
本文来自互联网用户投稿,文章观点仅代表作者本人,不代表本站立场,不承担相关法律责任。如若转载,请注明出处。 如若内容造成侵权/违法违规/事实不符,请点击【内容举报】进行投诉反馈!