文章目录
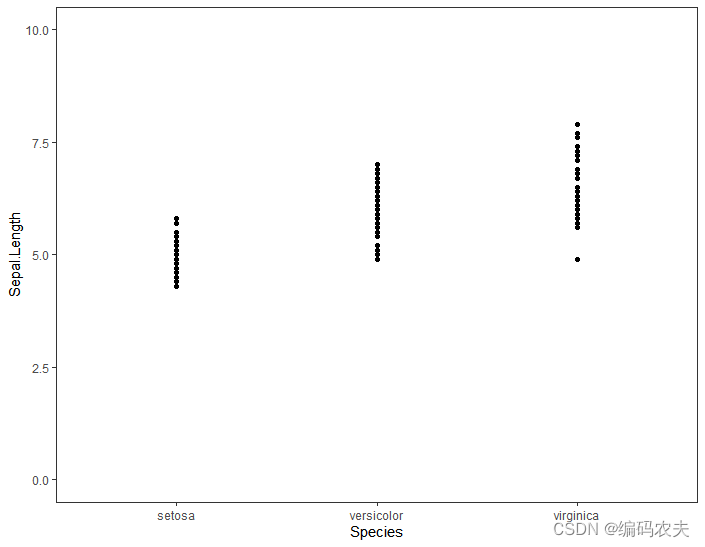
点图
library(tidyverse)theme_set(theme_test())
iris%>%ggplot(aes(x=Species,y=Sepal.Length),fill = "red",color="white")+geom_point(color="black",fill="white")+ylim(0,10)+labs(y="Sepal.Length")
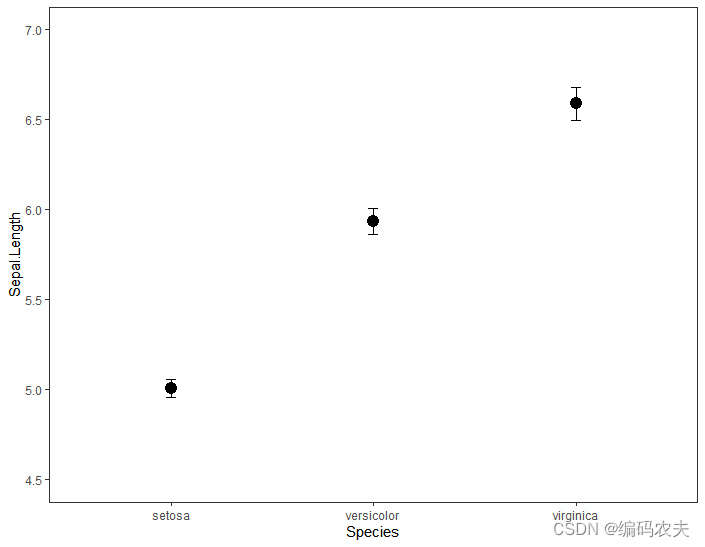
误差线点图
library(tidyverse)theme_set(theme_test())
library(sciplot)
iris%>%group_by(Species)%>%summarise(mean=mean(Sepal.Length),se=se(Sepal.Length))%>%ggplot(aes(x=Species,y=mean),fill = "red",color="white")+geom_point(color="black",size=4)+geom_errorbar(aes(ymin=mean-se,ymax=mean+se),width=0.05)+ylim(4.5,7)+labs(y="Sepal.Length")
本文来自互联网用户投稿,文章观点仅代表作者本人,不代表本站立场,不承担相关法律责任。如若转载,请注明出处。 如若内容造成侵权/违法违规/事实不符,请点击【内容举报】进行投诉反馈!
