gprof2dot perf
什么是gprof2dot
这是一个用于将许多探查器的输出转换为点图Python脚本。
使用需要安装的依赖
- Python: known to work with version 2.7 and 3.3; it will most likely not work with earlier releases.
- Graphviz: tested with version 2.26.3, but should work fine with other versions.
Linux users 使用
On Debian/Ubuntu run:
apt-get install python3 graphviz
On RedHat/Fedora run
yum install python3 graphviz
下载方式
-
PyPI
pip install gprof2dot
-
Standalone script
-
Git repository
虚拟机Linux使用perf stat提示cycles not supported
The cpu_core/cycles/ event is not supported.
查看perf stat只显示cpu-clock, context-switches, cpu-migrations
剩余cycles, instructions, branches, branch-misses均为not supported
原因分析
该参数使用物理机可测量,猜测问题出在虚拟化。
解决方案
关闭VMware虚拟机电源,找到硬件配置选项中CPU
勾选☑️虚拟化CPU性能计数器重启问题解决
虚拟机中为什么采集不了perf相关数据??
使用实例
使用perf工具生成采样数据,一直想要跟踪dd命令读取磁盘数据的调用栈,用perf试试看,根据以往调试的经验,会发现perf采集到的数据并不是非常详细的,抓的是调用流程上的主要函数,如果需要更详细的信息可以尝试使用ftrace。
-
使用
perf抓取采样数据,如果已经安装debuginfo的时候,可以指定栈遍历的方式为dwarf。root@curtis-Aspire-E5-471G:/home/curtis/write_code/jianshou/gprof2dot# perf record -g --call-graph dwarf -- dd if=/dev/sda of=./test.img bs=1M count=100 iflag=direct 100+0 records in 100+0 records out 104857600 bytes (105 MB, 100 MiB) copied, 0.349992 s, 300 MB/s [ perf record: Woken up 1 times to write data ] [ perf record: Captured and wrote 0.129 MB perf.data (577 samples) ] -
使用
gprof2dot生成dot图。root@curtis-Aspire-E5-471G:/home/curtis/write_code/jianshou/gprof2dot# perf script | c++filt | ./gprof2dot.py -f perf | dot -Tpng -o output.png

-
stdio,以文本的方式输出调用栈。
perf report --stdio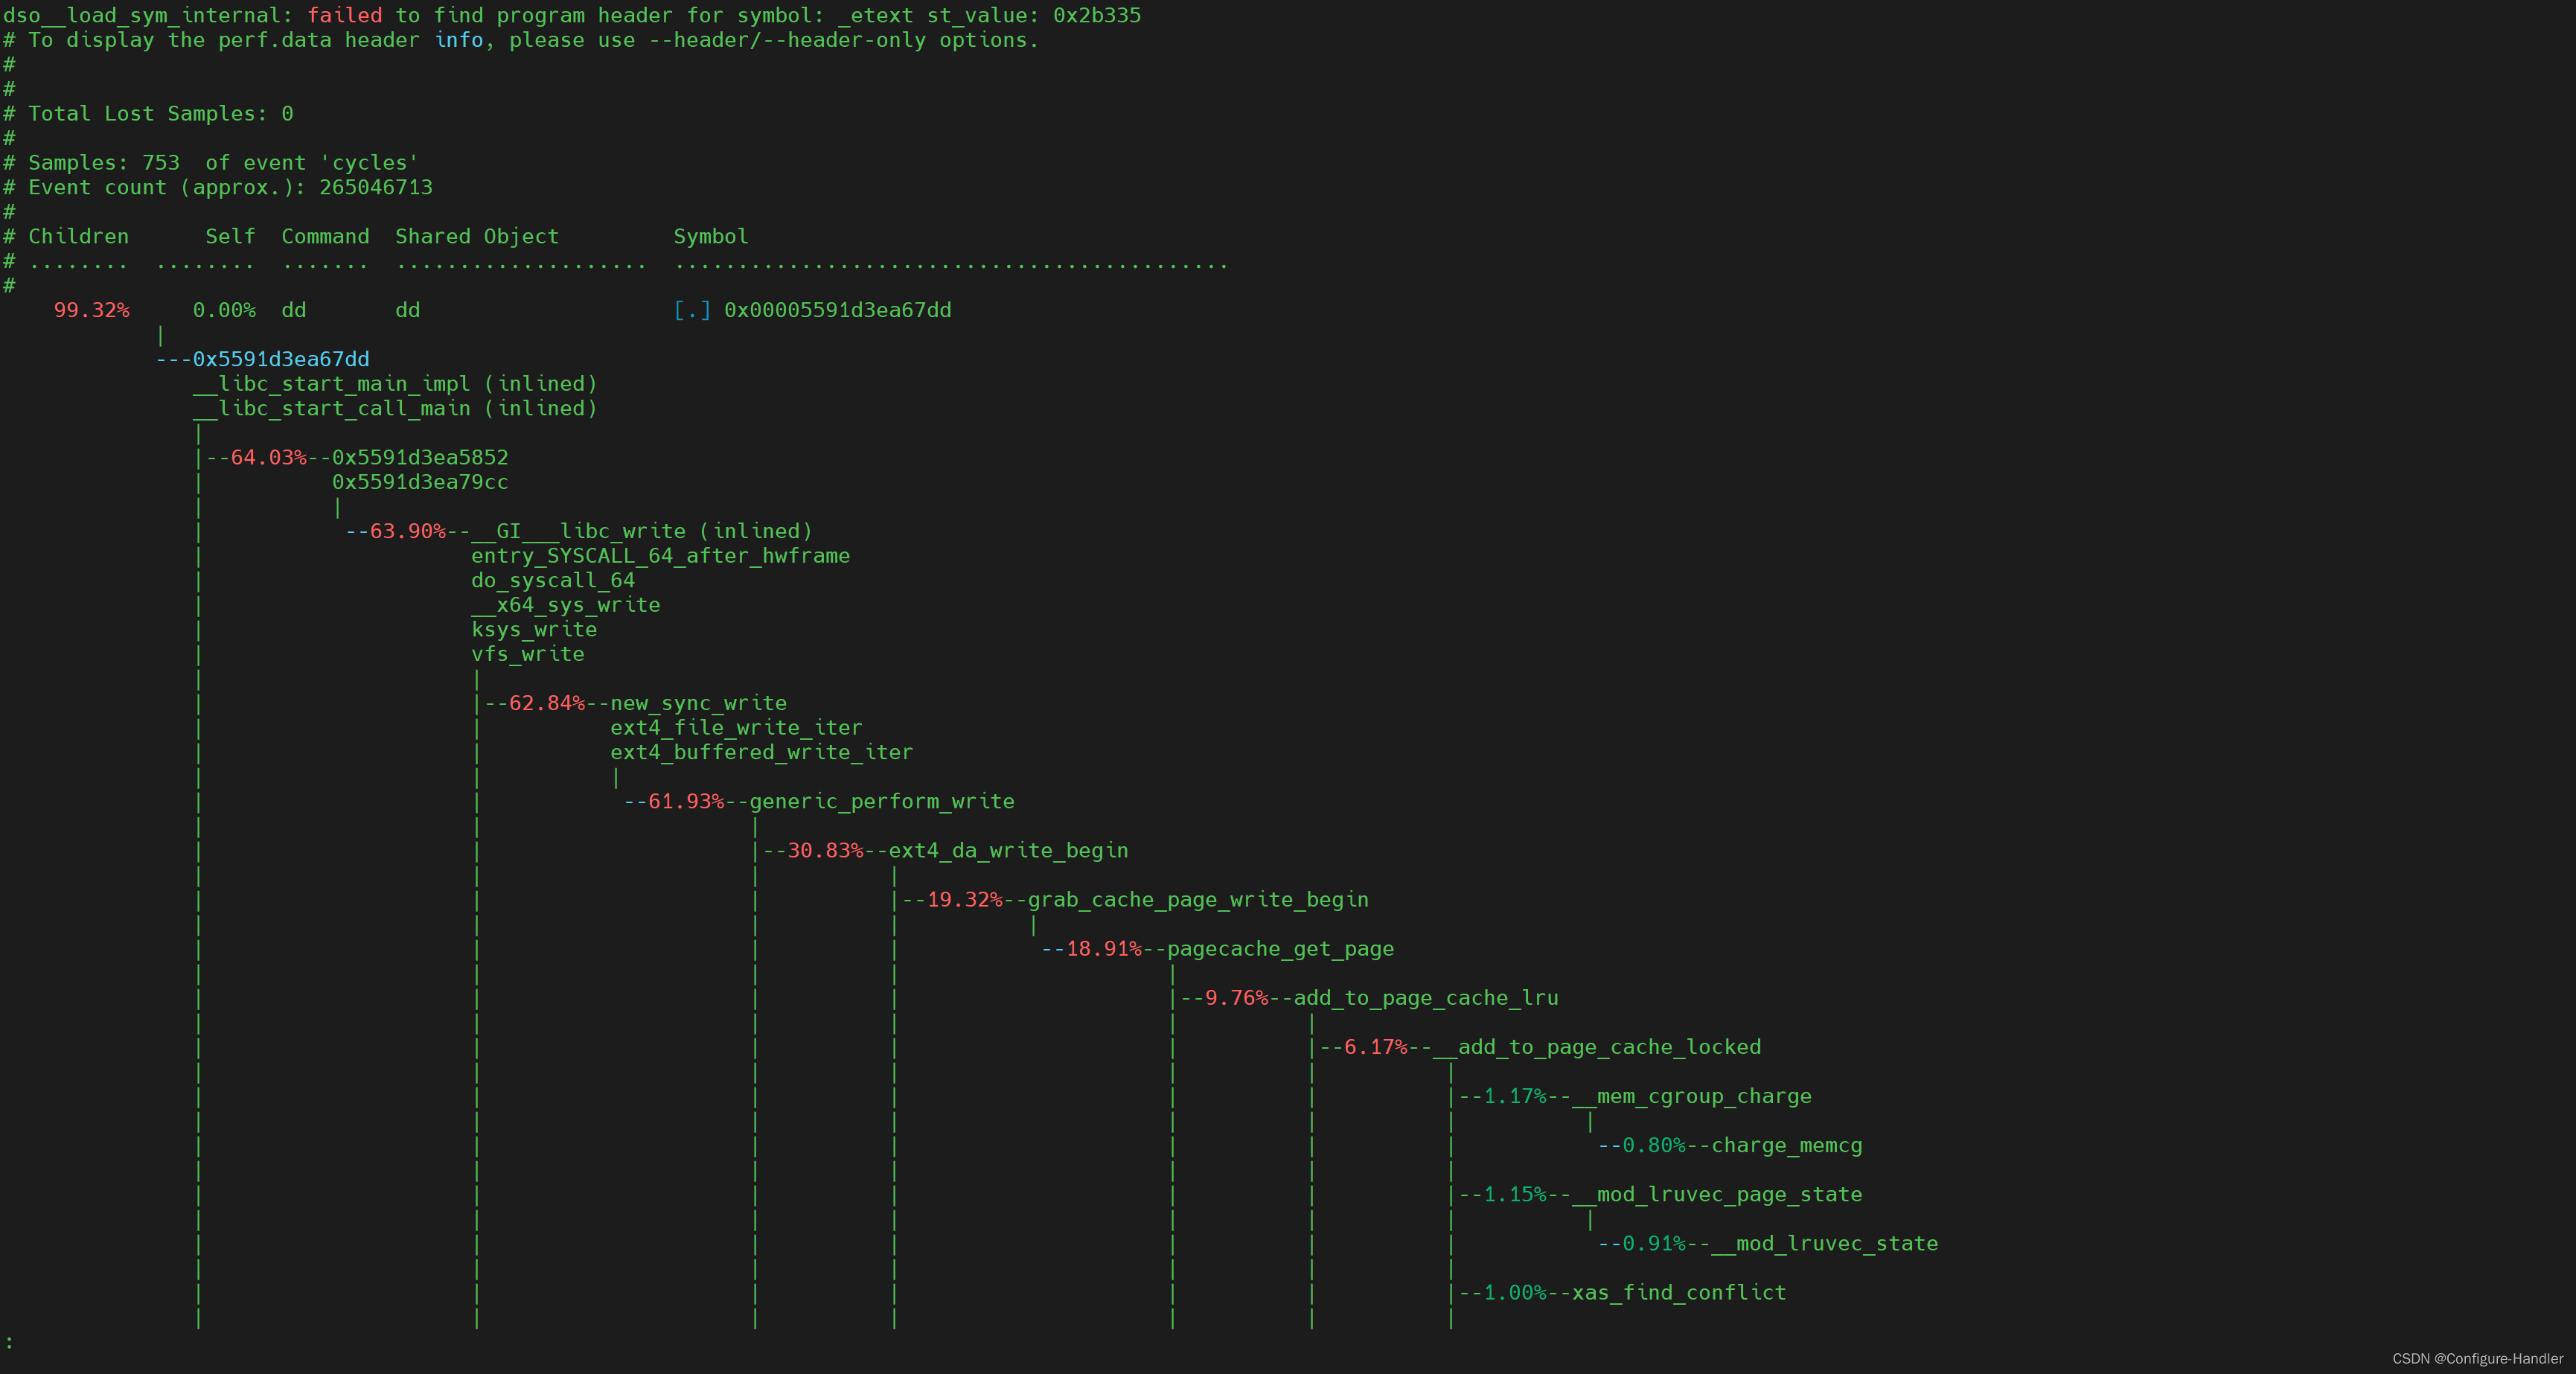
参数说明
root@curtis-Aspire-E5-471G:/home/curtis/write_code/jianshou/gprof2dot# ./gprof2dot.py -help
Usage:gprof2dot.py [options] [file] ...Options:-h, --help show this help message and exit-o FILE, --output=FILEoutput filename [stdout](输出文件名)-n PERCENTAGE, --node-thres=PERCENTAGEeliminate nodes below this threshold [default: 0.5]-e PERCENTAGE, --edge-thres=PERCENTAGEeliminate edges below this threshold [default: 0.1]-f FORMAT, --format=FORMAT(支持转换的文件类型)profile format: axe, callgrind, dtrace, hprof, json,oprofile, perf, prof, pstats, sleepy, sysprof or xperf[default: prof]--total=TOTALMETHOD preferred method of calculating total time: callratiosor callstacks (currently affects only perf format)[default: callratios]-c THEME, --colormap=THEMEcolor map: bw, color, gray, pink or print [default:color]-s, --strip strip function parameters, template parameters, andconst modifiers from demangled C++ function names--color-nodes-by-selftimecolor nodes by self time, rather than by total time(sum of self and descendants)-w, --wrap wrap function names--show-samples show function samples--node-label=MEASURE measurements to on show the node (can be specifiedmultiple times): self-time, self-time-percentage,total-time or total-time-percentage [default: total-time-percentage, self-time-percentage]--list-functions=LIST_FUNCTIONSlist functions available for selection in -z or -l,requires selector argument ( use '+' to select all).Recall that the selector argument is used withUnix/Bash globbing/pattern matching, and that entriesare formatted '::' . Whenargument starts with '%', a dump of all availableinformation is performed for selected entries, afterremoval of leading '%'.-z ROOT, --root=ROOT prune call graph to show only descendants of specifiedroot function-l LEAF, --leaf=LEAF prune call graph to show only ancestors of specifiedleaf function--depth=DEPTH prune call graph to show only descendants or ancestorsuntil specified depth--skew=THEME_SKEW skew the colorization curve. Values < 1.0 give morevariety to lower percentages. Values > 1.0 give lessvariety to lower percentages-p FILTER_PATHS, --path=FILTER_PATHSFilter all modules not in a specified path
本文来自互联网用户投稿,文章观点仅代表作者本人,不代表本站立场,不承担相关法律责任。如若转载,请注明出处。 如若内容造成侵权/违法违规/事实不符,请点击【内容举报】进行投诉反馈!