第一单元 用python学习微积分(一) 导数(下)- x^n 的导数
文章内容源于学习:麻省理工学院公开课:单变量微积分-导数和变化率-网易公开课
开发环境的准备
目录
一、首先用python求导
二、老办法,画函数曲线
三、解方程求截距, 当 y=0:
四、得到最终结果:
新的求导问题抛出:
一、首先用python求导
from sympy import *
x = Symbol('x')
n = Symbol('n')
f = x**n
derivative_f = f.diff(x)
derivative_f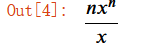
因为很少用python,所以不清楚为啥这个结果没有通分,修正下结果
接下来画个曲线和曲线的切线,检查这个求导的正确性
首先假设n=3
于是原有公式变为: , 导数为
二、老办法,画函数曲线
import matplotlib.pyplot as plt
import numpy as np
#画坐标轴
fig = plt.figure()
ax = fig.add_subplot(1, 1, 1)
ax.spines['left'].set_position('zero')
ax.spines['bottom'].set_position('zero')
ax.spines['right'].set_color('none')
ax.spines['top'].set_color('none')
ax.xaxis.set_ticks_position('bottom')
ax.yaxis.set_ticks_position('left')#画fx
x = np.linspace(0.1,np.pi,50)
y = x**3
plt.plot(x,y, 'm', label=' fx = x**3 ')
plt.legend(loc='upper right')plt.show()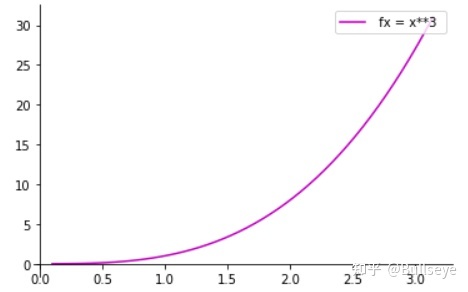
那这样再来个x=2时的切线( )
三、解方程求截距, 当 y=0:
x, y, x0, y0 = symbols('x y x0 y0')
expr = (y-y0)/(x-x0) - 3*x0**2
expr.subs(y,0).subs(y0, x0**3).subs(x0, 2)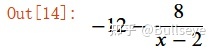
根据这个算式求解:
x = Symbol('x')
eq1 = Eq(-12-8/(x-2),0)
sol = solve(eq1)
sol
当x=0:
x, y, x0, y0 = symbols('x y x0 y0')
expr = (y-y0)/(x-x0) - 3*x0**2
expr.subs(x,0).subs(y0, x0**3).subs(x0, 2)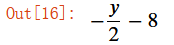
根据这个算式求解:
eq1 = Eq(-y/2 - 8,0)
sol = solve(eq1)
sol
于是得到切线两个点( 1/2, 0 ) , ( 0, -16 )
四、得到最终结果:
import matplotlib.pyplot as plt
import numpy as np
#画坐标轴
fig = plt.figure()
ax = fig.add_subplot(1, 1, 1)
ax.spines['left'].set_position('zero')
ax.spines['bottom'].set_position('zero')
ax.spines['right'].set_color('none')
ax.spines['top'].set_color('none')
ax.xaxis.set_ticks_position('bottom')
ax.yaxis.set_ticks_position('left')#画fx
x = np.linspace(0.1,np.pi,50)
y = x**3
plt.plot(x,y, 'm', label=' fx = x**3 ')
plt.legend(loc='upper right')p1 = [4/3, 0] #点p1的坐标值
p2 = [0, -16] #点p2的坐标值
plt.plot([p1[0], p2[0]], [p1[1], p2[1]], color='b', label='tangent line of fx on x=2')
plt.legend(loc='upper right')plt.scatter(2, 2**3, c='r', label='tangent point')
plt.legend(loc='upper right')plt.show()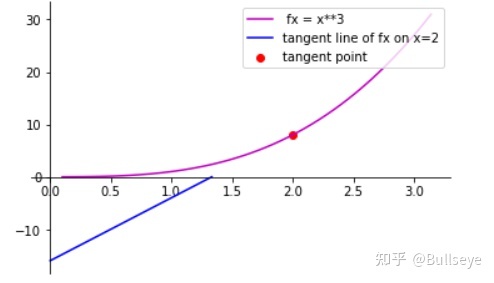
想当然了, 视频里老师用截距主要是求面积, 这里要修改下程序,输出比较完整的切线
由于切线经过x=3时会显得比较完整, 所以应当求x=3而不是x=0时切线上y的值
当 x=3
x, y, x0, y0 = symbols('x y x0 y0')
expr = (y-y0)/(x-x0) - 3*x0**2
expr.subs(x,3).subs(y0, x0**3).subs(x0, 2)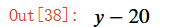
eq1 = Eq(y-20,0)
sol = solve(eq1)
sol
import matplotlib.pyplot as plt
import numpy as np
#画坐标轴
fig = plt.figure()
ax = fig.add_subplot(1, 1, 1)
ax.spines['left'].set_position('zero')
ax.spines['bottom'].set_position('zero')
ax.spines['right'].set_color('none')
ax.spines['top'].set_color('none')
ax.xaxis.set_ticks_position('bottom')
ax.yaxis.set_ticks_position('left')#画fx
x = np.linspace(0.1,np.pi,50)
y = x**3
plt.plot(x,y, 'm', label=' fx = x**3 ')
plt.legend(loc='upper right')p1 = [4/3, 0] #点p1的坐标值
p2 = [3, 20] #点p2的坐标值
plt.plot([p1[0], p2[0]], [p1[1], p2[1]], color='b', label='tangent line of fx on x=2')
plt.legend(loc='upper right')plt.scatter(2, 2**3, c='r', label='tangent point')
plt.legend(loc='upper right')plt.show()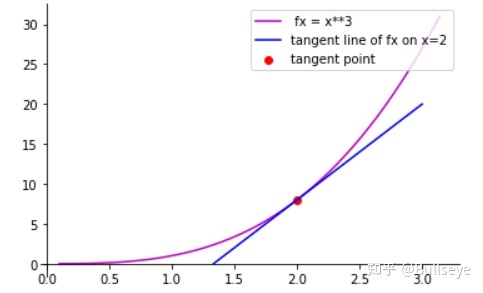
求导成功
编辑于 11-27 13:11
本文来自互联网用户投稿,文章观点仅代表作者本人,不代表本站立场,不承担相关法律责任。如若转载,请注明出处。 如若内容造成侵权/违法违规/事实不符,请点击【内容举报】进行投诉反馈!