在R的绘图中加入数学公式或者希腊字符
在R的绘图中加入数学公式或者希腊字符
- 在 plot函数中
- 在标题中和坐标轴中
- 在图内的数据点中
- 在ggplot2函数中
在 plot函数中
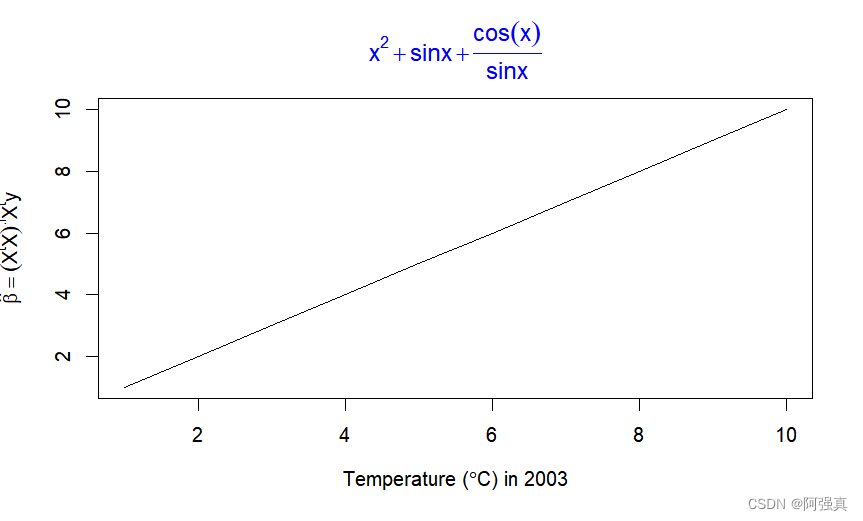
在标题中和坐标轴中
这里我先把xlab=“”,即x轴标题是空值,默认值是index防止设置时出现重叠情况
x<-1:10;x
plot(x,type="l",xlab="",ylab="")
title(main=expression(x^2+sinx+frac(cos(x),sinx)),col.main="blue",font=3,xlab=expression (paste("Temperature (", degree, "C) in 2003")),ylab=expression (hat ( beta) ==(X^t * X)^{.l}*X^t *y))
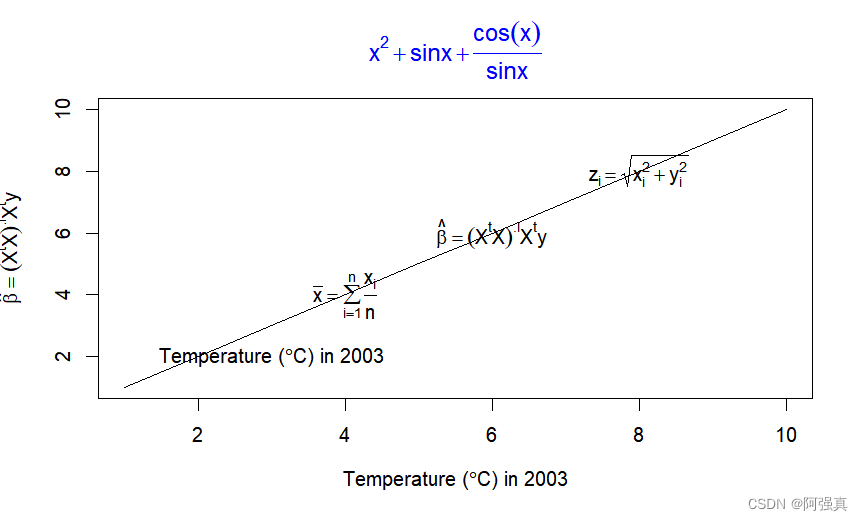
在图内的数据点中
text (3,2, expression (paste("Temperature (", degree, "C) in 2003")))
text (4,4,expression(bar(x) == sum(frac (x[i],n),i==1,n)))
text (6,6,expression (hat ( beta) ==(X^t * X)^{.l}*X^t *y))
text (8,8,expression(z[i] == sqrt (x[i]^2 + y[i] ^2)))
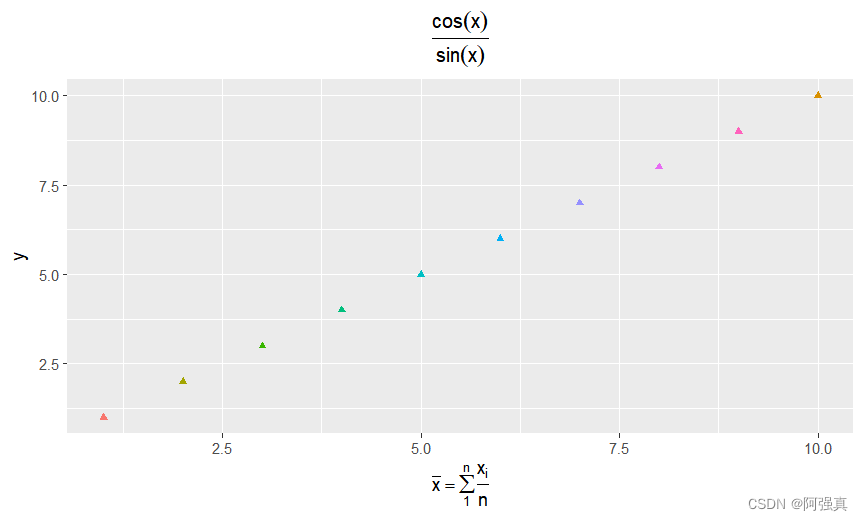
在ggplot2函数中
首先生成一个数据框
x <- 1:10 -> y
mn <- data.frame(x,y)
mn
ggplot(mn,aes(x,y,col=rownames(mn)))+geom_point(shape=17)+labs(title=expression(frac(cos(x),sin(x))),x=expression(bar(x)==sum(frac(x[i],n),1,n)))+theme(legend.position = "null",plot.title=element_text(size=12,hjust=0.5))
本文来自互联网用户投稿,文章观点仅代表作者本人,不代表本站立场,不承担相关法律责任。如若转载,请注明出处。 如若内容造成侵权/违法违规/事实不符,请点击【内容举报】进行投诉反馈!