《深入浅出Python机器学习》——决策树
决策树:实现分类
jupyter实现
import numpy as np
import matplotlib.pyplot as plt
from matplotlib.colors import ListedColormap
# 导入tree模型和数据集加载工具
from sklearn import tree, datasets# 导入数据集拆分工具
from sklearn.model_selection import train_test_split
wine = datasets.load_wine()# 只选取数据集的前两个特征
X = wine.data[:,:2]
y = wine.target# 将数据集拆分为训练集和测试集
X_train, X_test,y_train,y_test = train_test_split(X,y)# 设定决策树最大深度为5
clf2 = tree.DecisionTreeClassifier(max_depth=3)
# 重新拟合数据
clf2.fit(X_train,y_train)# 定义图像中分区的颜色和散点的颜色
cmap_light = ListedColormap(['#FFAAAA','#AAFFAA','#AAAAFF'])
cmap_bold = ListedColormap(['#FF0000','#00FF00','#0000FF'])# 分别用样本的两个特征值构建图像的横轴和纵轴
x_min, x_max = X_train[:,0].min()-1,X_train[:,0].max()+1
y_min, y_max = X_train[:,1].min()-1,X_train[:,1].max()+1xx,yy = np.meshgrid(np.arange(x_min,x_max,.02),np.arange(y_min,y_max,.02))
Z = clf2.predict(np.c_[xx.ravel(),yy.ravel()])# 给每个分类中的样本分配不同的颜色
Z = Z.reshape(xx.shape)
plt.figure()
plt.pcolormesh(xx,yy,Z,cmap=cmap_light)# 用散点把样本表示出来
plt.scatter(X[:,0],X[:,1],c=y,cmap=cmap_bold,edgecolor='k',s=20)
plt.xlim(xx.min(),xx.max())
plt.ylim(yy.min(),yy.max())
plt.title("Classifier:(max_depth=3)")
plt.show()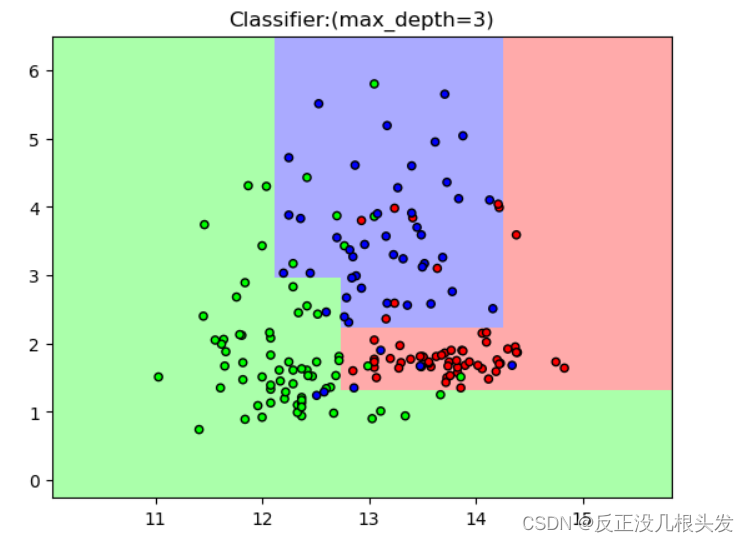
算法过程可视化
import graphviz
from sklearn.tree import export_graphviz# 选择最大深度为3的分类模型
export_graphviz(clf2,out_file="wine.dot",class_names=wine.target_names,feature_names=wine.feature_names[:2],impurity=False,filled=True)
#打开一个dot文件
with open("wine.dot") as f:dot_graph = f.read()
# 显示dot文件中的图形
graphviz.Source(dot_graph)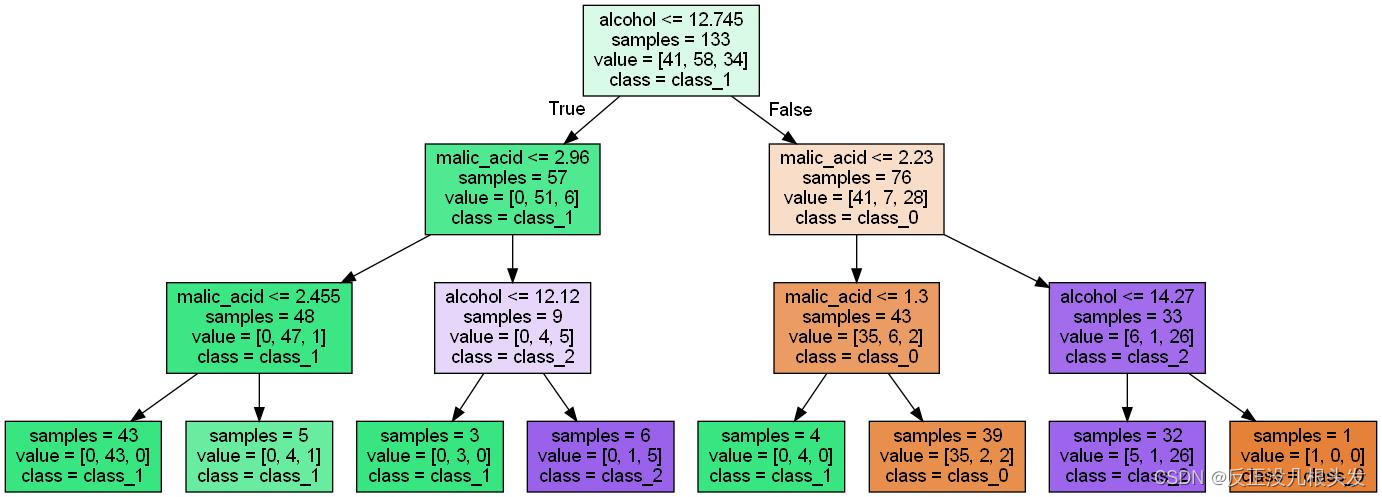
本文来自互联网用户投稿,文章观点仅代表作者本人,不代表本站立场,不承担相关法律责任。如若转载,请注明出处。 如若内容造成侵权/违法违规/事实不符,请点击【内容举报】进行投诉反馈!