数字图像处理作业:直方图双峰阈值法 python代码
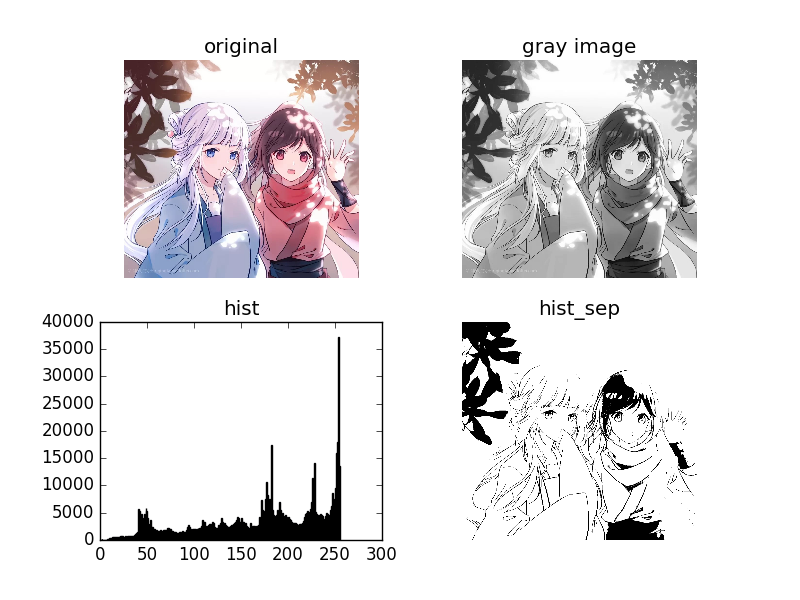
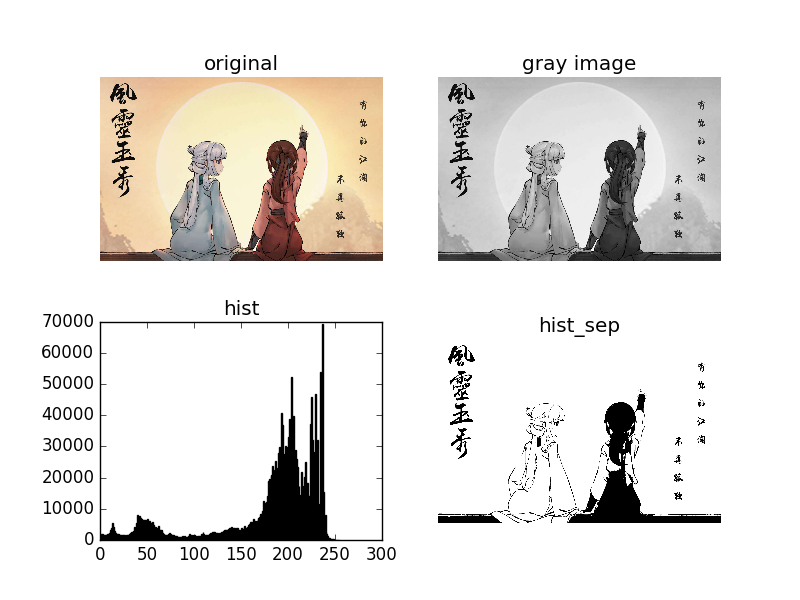
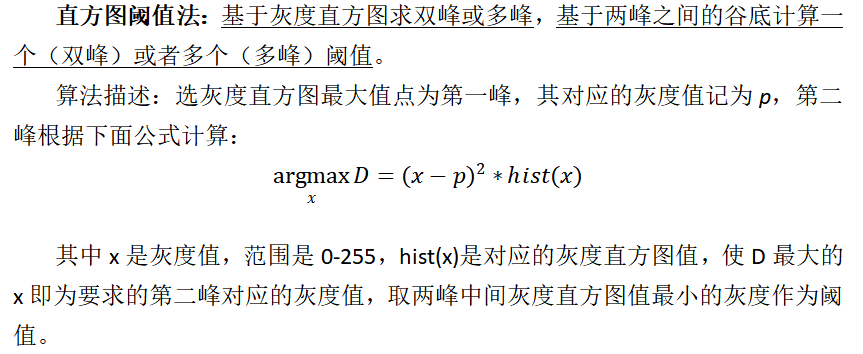
直方图阈值法 :基于灰度直方图求双峰或多峰,基于两峰之间的谷底计算一个(双峰)或者多个(多峰)阈值。
import cv2 as cv
import numpy as np
from matplotlib import pyplot as plt# 计算灰度直方图
def calcGrayHist(grayimage):# 灰度图像矩阵的高,宽rows, cols = grayimage.shape# 存储灰度直方图grayHist = np.zeros([256], np.uint64)for r in range(rows):for c in range(cols):grayHist[grayimage[r][c]] += 1return grayHist# 阈值分割:直方图技术法
def threshTwoPeaks(image):#转换为灰度图if len(image.shape) == 2:gray = imageelse:gray = cv.cvtColor(image, cv.COLOR_BGR2GRAY)# 计算灰度直方图histogram = calcGrayHist(gray)# 寻找灰度直方图的最大峰值对应的灰度值maxLoc = np.where(histogram == np.max(histogram))# print(maxLoc)firstPeak = maxLoc[0][0] #灰度值# 寻找灰度直方图的第二个峰值对应的灰度值measureDists = np.zeros([256], np.float32)for k in range(256):measureDists[k] = pow(k - firstPeak, 2) * histogram[k] #综合考虑 两峰距离与峰值maxLoc2 = np.where(measureDists == np.max(measureDists))secondPeak = maxLoc2[0][0]print('双峰为:',firstPeak,secondPeak)# 找到两个峰值之间的最小值对应的灰度值,作为阈值thresh = 0if firstPeak > secondPeak:  # 第一个峰值再第二个峰值的右侧temp = histogram[int(secondPeak):int(firstPeak)]minloc = np.where(temp == np.min(temp))thresh = secondPeak + minloc[0][0] + 1else:  # 第一个峰值再第二个峰值的左侧temp = histogram[int(firstPeak):int(secondPeak)]minloc = np.where(temp == np.min(temp))thresh = firstPeak + minloc[0][0] + 1# 找到阈值之后进行阈值处理,得到二值图threshImage_out = gray.copy()# 大于阈值的都设置为255threshImage_out[threshImage_out > thresh] = 255threshImage_out[threshImage_out <= thresh] = 0return thresh, threshImage_outif __name__ == "__main__":img = cv.imread('1.jpg')#img = cv.imread('2.png')img_gray = cv.cvtColor(img, cv.COLOR_RGB2GRAY)#灰度直方图曲线hist = cv.calcHist([img_gray], [0], None, [256], [0, 255]) #对图像像素的统计分布,它统计了每个像素(0到L-1)的数量。plt.plot(hist)plt.show()#灰度直方图plt.hist(img_gray.ravel(), 256), plt.title('hist') #ravel()方法将数组维度拉成一维数组# plt.show()plt.savefig('1_hist.png')thresh, img_sep = threshTwoPeaks(img)print('灰度阈值为:',thresh)cv.imwrite('1_sep.png', img_sep)# cv.imwrite('2_sep.png', img_sep)
本文来自互联网用户投稿,文章观点仅代表作者本人,不代表本站立场,不承担相关法律责任。如若转载,请注明出处。 如若内容造成侵权/违法违规/事实不符,请点击【内容举报】进行投诉反馈!