echars 柱图X轴滑动鼠标显示所有柱图
echars 柱图X轴滑动鼠标显示所有柱图
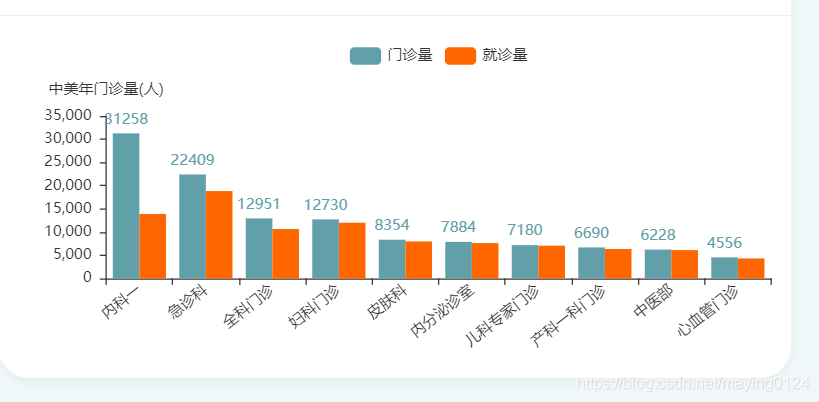
由于X轴科室很多,所以做了拖动鼠标可以查看所有的科室信息,滑动滚轮要吧改变柱状图的大小多少。主要是添加 dataZoom节点
dataset节点,是加载数据为键值对类型,
encode:{
x:‘deptname’,
y:‘visit’
},
节点为dataset里数据的 key值对应的 x,y轴的数据
formatter:’{@reg}’ 节点中reg也为dataset里数据的
$(function(){charts1 = echarts.init(document.getElementById('chart01'),'light');chartsColumnOptionsDouble(charts1, char1,"门诊量","就诊量", '人', "data2",'XX年门诊量');
});/*柱状双柱*/function chartsColumnOptionsDouble(containerid, data1, title1,title2, unit, data2,orgname ) {option = {tooltip : {trigger : 'axis',axisPointer : {type : 'cross',crossStyle : {color : '#999'}}},legend : {data : [title1,title2 ], show:true},dataZoom:[{startValue: 0, // 从头开始。endValue: 10,  // 一次性展示10个。 type: 'inside',  //slider会显示一个滚动条show: true,  xAxisIndex: [0],  handleSize: 0,//滑动条的 左右2个滑动条的大小  height: 8,//组件高度  left: 50, //左边的距离  right: 40,//右边的距离  bottom: 26,//右边的距离  handleColor: '#ddd',//h滑动图标的颜色  handleStyle: {  borderColor: "#cacaca",  borderWidth: "1",  shadowBlur: 2,  background: "#ddd",  shadowColor: "#ddd",  },  fillerColor: new echarts.graphic.LinearGradient(1, 0, 0, 0, [{  //给颜色设置渐变色 前面4个参数,给第一个设置1,第四个设置0 ,就是水平渐变  //给第一个设置0,第四个设置1,就是垂直渐变  offset: 0,  color: '#1eb5e5'  }, {  offset: 1,  color: '#5ccbb1'  }]),  backgroundColor: '#ddd',//两边未选中的滑动条区域的颜色  showDataShadow: false,//是否显示数据阴影 默认auto  showDetail: false,//即拖拽时候是否显示详细数值信息 默认true  handleIcon: 'M-292,322.2c-3.2,0-6.4-0.6-9.3-1.9c-2.9-1.2-5.4-2.9-7.6-5.1s-3.9-4.8-5.1-7.6c-1.3-3-1.9-6.1-1.9-9.3c0-3.2,0.6-6.4,1.9-9.3c1.2-2.9,2.9-5.4,5.1-7.6s4.8-3.9,7.6-5.1c3-1.3,6.1-1.9,9.3-1.9c3.2,0,6.4,0.6,9.3,1.9c2.9,1.2,5.4,2.9,7.6,5.1s3.9,4.8,5.1,7.6c1.3,3,1.9,6.1,1.9,9.3c0,3.2-0.6,6.4-1.9,9.3c-1.2,2.9-2.9,5.4-5.1,7.6s-4.8,3.9-7.6,5.1C-285.6,321.5-288.8,322.2-292,322.2z',  filterMode: 'filter'},//下面这个属性是里面拖到  {  type: 'inside',  show: true,  xAxisIndex: [0],  start: 0,//默认为1  end: 50}, ],dataset:[{source:data1}],xAxis : [ {type : 'category',/* 	data : [ '感染科', '口腔科', '五官科', '西医内科', '西医外科', '针剂医疗科', '中医儿科', '中医妇科', '中医骨科', '中医内科','心内科','肾病二门诊','肿瘤科','眼科一','急诊科','呼吸科','口腔科','皮肤科','输血科','肛肠科'], */axisPointer : {type : 'shadow'},axisLabel: {interval:0, //坐标刻度之间的显示间隔,默认就可以了(默认是不重叠)rotate:38   //调整数值改变倾斜的幅度(范围-90到90)},splitLine:{show:false}} ],yAxis : [ {type : 'value',name : orgname + '('+unit+')',//min: 0,//max: 100000,//interval: 500, axisLabel : {formatter : '{value} ' },splitLine:{show:false}} ],series : [ {name : '门诊量',type : 'bar',//barWidth:15,barGap:'0%',/* data: [2200, 3200, 4000, 5000, 2600, 2100, 2000, 3000, 2500, 4120,2200, 3200, 4000, 5000, 2600, 2100, 2000, 3000, 2500, 4120], */encode:{x: 'deptname',y: 'reg'},//data : data1,itemStyle: {normal: {label : {show:true,position:'top',formatter:'{@reg}'},color:"#61a0a8",textStyle: {color:"#61a0a8"}}}	 },{name : '就诊量',type : 'bar',//barWidth:15,/* data: [1200, 2200, 3000, 4000, 1600, 1100, 1000, 2000, 1500, 3120,1200, 2200, 3000, 4000, 1600, 1100, 1000, 2000, 1500, 3120], *///data:data3,encode:{x:'deptname',y:'visit'},itemStyle: {normal: {color:"#FF6600",textStyle: {color:"#FF6600"}}}	 }]};containerid.setOption(option);}
<div class="iq-card-body" ><div id="chart01" style="height: 250px;margin- right:-70px;border:0px solid red;">div>
div>
本文来自互联网用户投稿,文章观点仅代表作者本人,不代表本站立场,不承担相关法律责任。如若转载,请注明出处。 如若内容造成侵权/违法违规/事实不符,请点击【内容举报】进行投诉反馈!