Echarts highlight line tooltip
产品需求:如果折线图数据量过多时,会出现看不清楚的情况,所以希望能高亮当前点击的线,并在tooltip高亮当前点
tooltip配置:
tooltip: {trigger: 'axis',formatter: (params) => {let html = '';params.forEach(i => {const isHighlight = target.currentDataIndex === i.dataIndex && target.currentSeriesIndex === i.seriesIndex;html += `${isHighlight ? 'red' : '#000'} ">${i.seriesName}:${i.value}
`})return html;}
}
echarts监听事件:
const target = {};
myChart.on('mousemove', function (e) {//通过事件获取坐标点target.currentSeriesIndex=e.seriesIndextarget.currentDataIndex=e.dataIndexmyChart.setOption({series: {name: e.seriesName,lineStyle: {width: 4}}})
})
myChart.on('mouseout',function(e){target.currentSeriesIndex=0target.currentDataIndex=0myChart.setOption({series: {name: e.seriesName,lineStyle: {width: 2}}})
})
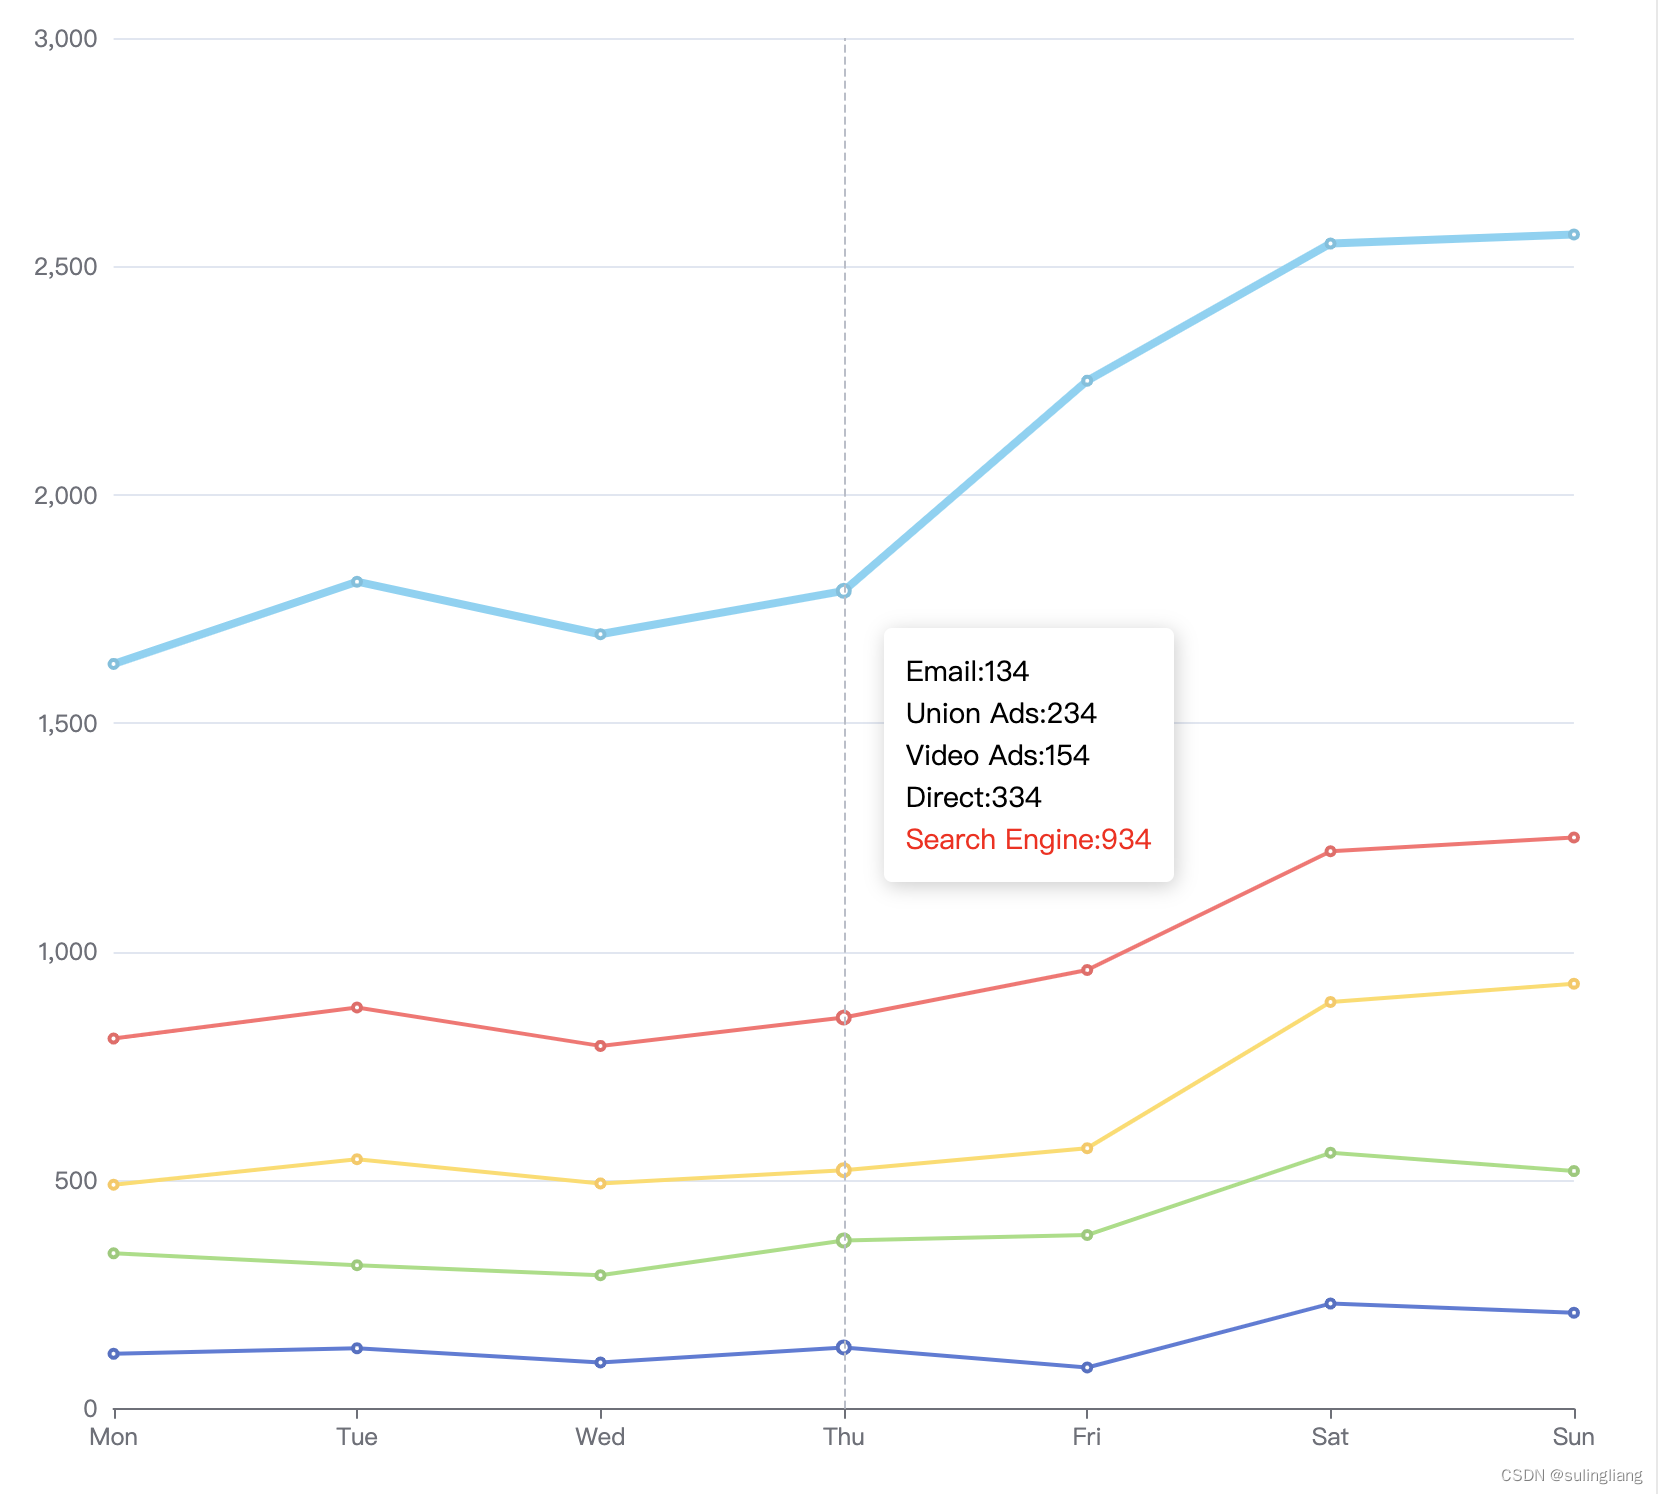
效果图:
本文来自互联网用户投稿,文章观点仅代表作者本人,不代表本站立场,不承担相关法律责任。如若转载,请注明出处。 如若内容造成侵权/违法违规/事实不符,请点击【内容举报】进行投诉反馈!