vue3关于Echarts的简单使用及配置
前言:
ECharts,一个使用 JavaScript 实现的开源可视化库,可以流畅的运行在 PC 和移动设备上,兼容当前绝大部分浏览器(IE9/10/11,Chrome,Firefox,Safari等),底层依赖矢量图形库 ZRender,提供直观,交互丰富,可高度个性化定制的数据可视化图表。
1、安装
(1)安装echarts包
npm install echarts --save
cnpm install echarts --save
(2)安装vue echarts工具包
npm install echarts vue-echarts
cnpm install echarts vue-echarts
2、挂载
(1)按需引入的挂载方式
本文选择vue3,以下是挂载/注册方式:
import { createApp } from 'vue'
import ECharts from 'vue-echarts'
import { use } from "echarts/core";// 手动引入 ECharts 各模块来减小打包体积
import {CanvasRenderer
} from 'echarts/renderers'
import {BarChart
} from 'echarts/charts'
import {GridComponent,TooltipComponent
} from 'echarts/components'use([CanvasRenderer,BarChart,GridComponent,TooltipComponent
]);const app = createApp(...)// 全局注册组件(也可以使用局部注册)
app.component('v-chart', ECharts)
(2)全局引入的挂载方式
在main.js文件中
import { createApp } from 'vue'
import App from './App.vue'       import ECharts from 'vue-echarts'  // 引入ECharts
import "echarts";                  // 全局引入echarts// 挂载ECharts   参数1:vue文件中挂载echarts的名字  参数2:挂载的组件
const app=createApp(App)
app.component('ECharts',ECharts)
app.mount('#app')
3、示例
3.1 情形一:一个页面中只使用1~2个ECharts图表
<template>
<div><e-charts class="chart" :option="option" />
</div></template><script setup>
import { ref,computed } from 'vue'const data = ref([{value:67,name:'A'},{value:40,name:'B'},{value:120,name:'C'},{value:58,name:'D'},{value:85,name:'E'},
])setInterval(()=>{data.value = data.value.map(item=>({...item,value:Math.random()*100,}))
},1000)const option = computed(()=>{return {xAxis: {type: 'category',data: data.value.map(el=>el.name)},yAxis: {type: 'value'},series: [{data: data.value.map(el=>el.value),type: 'line'}]}
})
</script><style scoped>
.chart {height: 400px;
}
</style>
3.1 情形二:一个页面中使用了多个ECharts图表
注意:如果要在一个页面中使用多个ECharts图表,就会出现很多很多option和类名chart,容易混乱,所以最好把图表们封装成组件使用。
(1)组件
<template><div><e-charts id="main" class="chart" :option="option" /></div>
</template><script setup>
import { onMounted } from "vue";
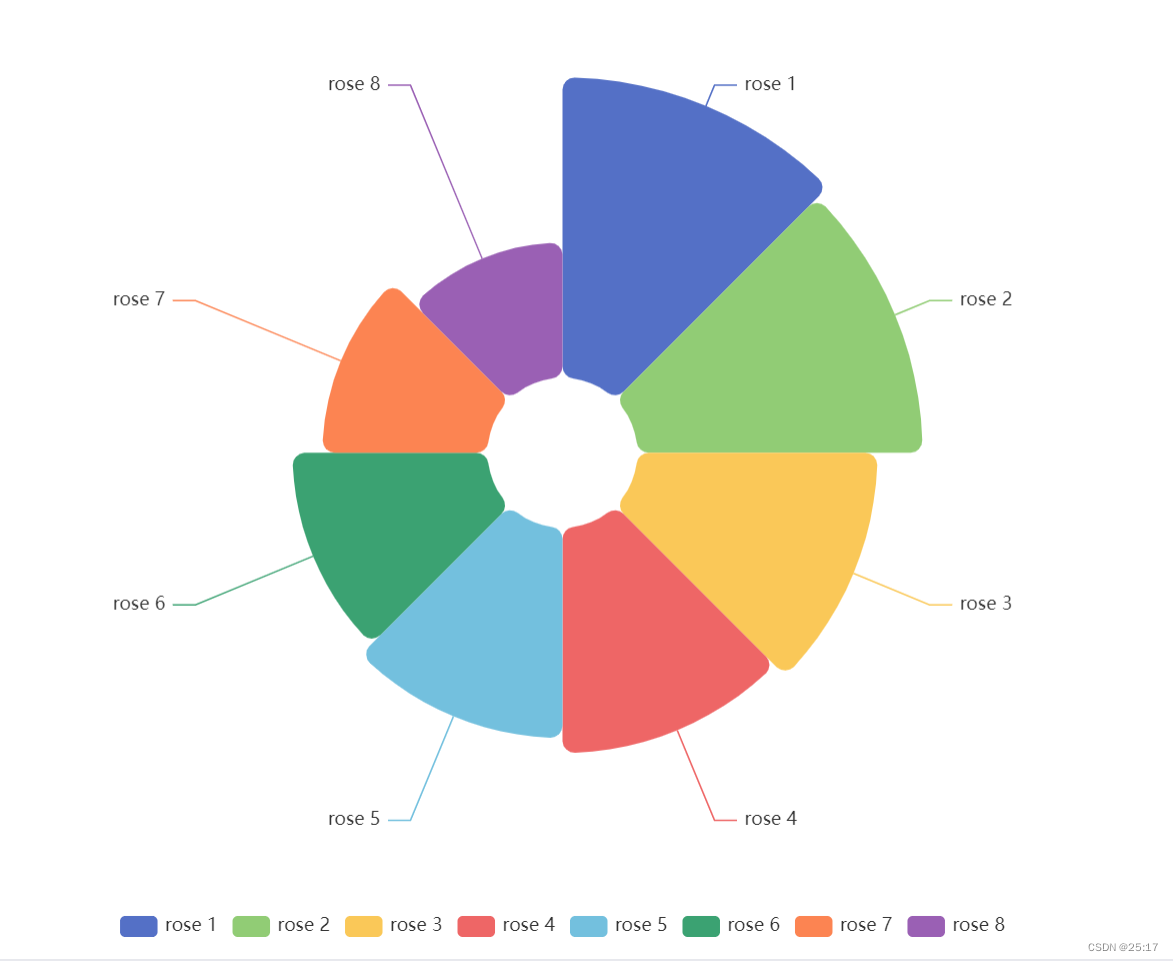
import * as echarts from 'echarts';onMounted(() => {var chartDom = document.getElementById('main');var myChart = echarts.init(chartDom);var option;option = {legend: {top: 'bottom'},toolbox: {show: true,feature: {mark: { show: true },dataView: { show: true, readOnly: false },restore: { show: true },saveAsImage: { show: true }}},series: [{name: 'Nightingale Chart',type: 'pie',radius: [50, 250],center: ['50%', '50%'],roseType: 'area',itemStyle: {borderRadius: 8},data: [{ value: 40, name: 'rose 1' },{ value: 38, name: 'rose 2' },{ value: 32, name: 'rose 3' },{ value: 30, name: 'rose 4' },{ value: 28, name: 'rose 5' },{ value: 26, name: 'rose 6' },{ value: 22, name: 'rose 7' },{ value: 18, name: 'rose 8' }]}]};option && myChart.setOption(option);
});
</script><style scoped>
// 宽高根据自身情况调整
.chart {width: 500px;height: 500px;
}
</style>
(2)vue文件中
<template><div class="echarts"><Nightingale /></div>
</template><script setup>
// 根据自身组件存放的位置进行引入
import Nightingale from "@/components/Echarts/NightingaleChart.vue";
</script><style scoped>
.echarts {height: 500px;width: 500px;
}
</style>
(3)效果
可以根据自身情况对options内的数据进行调整
本文来自互联网用户投稿,文章观点仅代表作者本人,不代表本站立场,不承担相关法律责任。如若转载,请注明出处。 如若内容造成侵权/违法违规/事实不符,请点击【内容举报】进行投诉反馈!