NgxCharts-折线图-ang2+
折线图
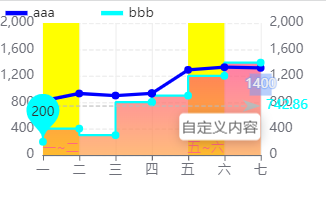
<div echarts [options]="echartsNgxLine" style="width: 300px;height: 200px;">div>
import * as echarts from 'echarts';// 折线图echartsNgxLine: any;echartsNgxLineDataY: any = [[820, 932, 901, 934, 1290, 1330, 1320],[200, 400, 300, 800, 900, 1200, 1400],];echartsNgxLineDataX: any = ['一', '二', '三', '四', '五', '六', '七'];ngOnInit(): void {this.echartsNgxMethodLine();}// 折线图echartsNgxMethodLine() {this.echartsNgxLine = {// 悬浮tiptooltip: {trigger: 'axis',backgroundColor: '#fff', //标题背景色borderColor: '#aaa', //边框颜色borderWidth: 0, //边框线宽confine: true, //悬浮窗限制在图标内enterable: false, //鼠标是否可以进入悬浮窗内padding: [2, 2, 2, 2], //内容距离边框边距fontSize: 16,color: '#0ff',formatter: (params: any) => {//模板变量有 {a}, {b},{c},{d},{e},分别表示系列名,数据名,数据值等return `自定义内容`;},axisPointer: { type: 'none' }, //悬浮的线消失},// 图例leglegend: {top: '0%', //图例位置left: '0%', //图例位置data: [{name: 'aaa', //图例文本icon: 'rect', // 图例形状circle圆形 rect矩形 roundRect圆角矩形 triangle三角形 diamond菱形 pin水滴 arrow箭头 none无// 图例文本样式color: 'rgba(0,0,0,0.85)',},{name: 'bbb',icon: 'rect',color: 'rgba(0,0,0,0.85)',},],selectedMode: 'multiple', //只展示一条数据single还是全部展示multiplebottom: 12, //图例方向itemHeight: 4, //图例高度itemWidth: 20, //图例宽度itemGap: 42, //主副标题纵向间距},// 图形位置grid: {top: 20, //上right: 24, //右bottom: 40, //下left: 0, //左containLabel: true, //是否包含坐标刻度轴},// x轴xAxis: {type: 'category',data: this.echartsNgxLineDataX,boundaryGap: false, //true 有留白(点在刻度中间) false 无留白(在刻度上起始在x0位置)// x轴文本样式axisLabel: {interval: 0,formatter: (val: any, i: number) => {let xAxisLength: any = Math.max(this.echartsNgxLineDataX.length);if (xAxisLength > 7) {if (i == 0) {//展示第一个return val;} else if (i == xAxisLength - 1) {//展示最后一个return val;} else if (i % 3 == 0) {//每隔三个展示一个return val;} else {//其他展示空return '';}} else {return val;}},rotate: 0, //旋转padding: [0, 0, 0, 0], //微调文本距离},axisTick: {// 坐标轴的刻度show: true, // 是否显示},axisLine: {// 坐标轴的轴线show: true, // 是否显示},splitLine: {//背景线show: true,lineStyle: {color: ['#eee'],width: 1,type: 'solid',},},},yAxis: [{type: 'value',min: 0, //最小值max: this.ceilFuns(this.echartsNgxLineDataY), //最大值interval: this.ceilFuns(this.echartsNgxLineDataY) / 5, //刻度线平均分成几份axisTick: {// 坐标轴的刻度show: false, // 是否显示},axisLine: {// 坐标轴的轴线show: false, // 是否显示},splitLine: {//背景线show: true,lineStyle: {color: ['#eee'],width: 1,type: 'dashed',},},},{type: 'value',min: 0, //最小值max: this.ceilFuns(this.echartsNgxLineDataY), //最大值interval: this.ceilFuns(this.echartsNgxLineDataY) / 5, //刻度线平均分成几份axisTick: {// 坐标轴的刻度show: false, // 是否显示},axisLine: {// 坐标轴的轴线show: false, // 是否显示},splitLine: {//背景线show: true,lineStyle: {color: ['#eee'],width: 1,type: 'dashed',},},},],color: ['#00f', '#0ff'], //折现点颜色series: [{name: 'aaa', //名字symbol: 'circle', // 图例形状circle圆形 rect矩形 roundRect圆角矩形 triangle三角形 diamond菱形 pin水滴 arrow箭头 none无symbolSize: 7, //折现圆点大小// 折现样式itemStyle: {lineStyle: {color: '#00f',},},data: this.echartsNgxLineDataY[0],type: 'line', //类型},{name: 'bbb', //名字symbol: 'circle', // 图例形状circle圆形 rect矩形 roundRect圆角矩形 triangle三角形 diamond菱形 pin水滴 arrow箭头 none无symbolSize: 7, //折现圆点大小smooth: true, //曲线圆滑// 折现样式itemStyle: {lineStyle: {type: 'dashed', //线条形状width: 2, //线宽color: new echarts.graphic.LinearGradient(0,1,0,0,[{offset: 0,color: '#0ff', // 0% 处的颜色},{offset: 1,color: '#ff0', // 100% 处的颜色},],false),},},step: 'start', //阶梯式start阶梯 middle阶梯 end阶梯// 背景areaStyle: {color: new echarts.graphic.LinearGradient(0, 0, 0, 1, [{offset: 0,color: 'rgb(255, 70, 131)',},{offset: 1,color: 'rgb(255, 158, 68)',},]),},markPoint: {//最大值 最小值data: [{type: 'max',name: '最大值',itemStyle: {color: 'rgba(115, 159, 250, .5)',},symbol: 'rect',symbolSize: [20, 20], // 容器大小symbolOffset: [0, 20], //位置偏移},{ type: 'min', name: '最小值' },],},markLine: {//平均线设置silent: true, //true 去掉鼠标悬浮该线上的动画symbol: ['none', 'arrow'], //该线无样式 (箭头)label: {show: true, //该线上的值去掉color: '#0ff',},lineStyle: {//设置该线样式width: 1,type: 'dashed',color: '#bbb',},data: [{yAxis: this.markNum(this.echartsNgxLineDataY[1]), //线的值name: 'bbb',},],},markArea: {//范围data: [// 第一个区间 对应xAxis的data数据[{ xAxis: '一' }, { xAxis: '二' }],[{ xAxis: '五' }, { xAxis: '六' }],],itemStyle: {//柱子颜色color: 'yellow',},label: {//是否显示文字show: true,position: ['0%', '90%'],color: '#f0f',fontSize: 12,rotate: 0,formatter: function (params: any) {return `${params.data.coord[0][0]}~${params.data.coord[1][0]}`;},},},data: this.echartsNgxLineDataY[1],type: 'line', //类型},],};}// 最大值maxNum(data: any) {return Math.max.apply(null, [...data.flat(Infinity)]);}// 平均值markNum(data: any) {return this.toFixeds(eval(data.join('+')) / data.length, 2);}// 四舍五入toFixeds(value: number, digst: number) {let value1: any = value + '';if (!digst) digst = 0;if (value1.indexOf('.') == -1) value1 += '.';value1 += new Array(digst + 1).join('0');if (new RegExp('^(-|\\+)?(\\d+(\\.\\d{0,' + (digst + 1) + '})?)\\d*$').test(value1)) {let value1: any = '0' + RegExp.$2,pm = RegExp.$1,a = RegExp.$3.length,b = true;if (a == digst + 2) {let a: any = value1.match(/\d/g);if (parseInt(a[a.length - 1]) > 4) {for (var i = a.length - 2; i >= 0; i--) {a[i] = parseInt(a[i]) + 1;if (a[i] == 10) {a[i] = 0;b = i != 1;} else break;}}value1 = a.join('').replace(new RegExp('(\\d+)(\\d{' + digst + '})\\d$'), '$1.$2');}if (b) value1 = value1.substr(1);return (pm + value1).replace(/\.$/, '');}return this + '';}// 取整ceilFuns(num: any) {let maxA: any;if (Array.isArray(num)) {num = num.flat(Infinity);num = Math.max.apply(null, num);}let numLength: any = num.toString().length - 1;let maxOnce: any = num.toString().slice(0, 1);let maxAi: any = num.toString().slice(1, numLength + 1);maxAi == 0 ? (maxA = maxOnce) : (maxA = (maxOnce - -1).toString());for (let i = 0; i < numLength; i++) {maxA += i * 0;}return Number(maxA);}
本文来自互联网用户投稿,文章观点仅代表作者本人,不代表本站立场,不承担相关法律责任。如若转载,请注明出处。 如若内容造成侵权/违法违规/事实不符,请点击【内容举报】进行投诉反馈!