Angualr集成arcgis
刚接触这个arcgis,做个记录;特别是angular中引入;
1.需要引入esri-loader来加载map,view以及图层等用到的模块;
在package.json中添加引用的包:
"esri-loader": "^2.13.0"
2.开发具体的地图,这里先以点图为例
首先页面的html元素内容:
然后component中会将地图绑定到这个dom元素上来;下面是component中的内容:
1>首先导入需要的模块,比如map和view等模块
const [Map, MapView, BaseMap, Extent, TileLayer, FeatureLayer, HeatmapRenderer, esriConfig, urlUtils,Graphic,GraphicsLayer] = await loadModules(['esri/Map','esri/views/MapView','esri/Basemap','esri/geometry/Extent','esri/layers/TileLayer','esri/layers/FeatureLayer','esri/renderers/HeatmapRenderer','esri/config','esri/core/urlUtils',"esri/Graphic","esri/layers/GraphicsLayer",'dojo/domReady!'
]);
2>先构造一个最底层的map
这里的arcgis服务使用的是'http://map.geoq.cn/ArcGIS/rest/services/ChinaOnlineCommunity/MapServer';
function getBaseMap(basemapcof) {const baselayer = new TileLayer({url: basemapcof.layer});return new BaseMap({baseLayers: baselayer,title: basemapcof.title,});
}const map = new Map({basemap: getBaseMap({title: '影像图',type: 'tile',layer: 'http://map.geoq.cn/ArcGIS/rest/services/ChinaOnlineCommunity/MapServer'})
});
3>构造一个view层来加载map
const view = new MapView({container: this.mapViewEl.nativeElement,map: map,extent: new Extent({xmin: 120.80012536879065,ymin: 30.54553222673087,xmax: 122.27874755895266,ymax: 31.945383160404504,spatialReference: {wkid: 4326}})
});
view.zoom = 19;
view.scale = 24000;
view.center = [121.38445719, 31.75367695];
view.ui._removeComponents(['attribution']);
代码说明,container是地图绑定的dom元素;所以在component中需要定义dom元素的变量如下
@ViewChild('mapViewNode', {static: true}) private mapViewEl: ElementRef; //mapViewNode跟html中的dom元素设置一样的;
extent中是地图的经纬度的返回,用于初始化的时候地图加载的边界;
至此,基础的地图就可以显示并加载出来了;
3.添加点图层
如果我们需要在地图上添加很多基于经纬度的点来标示,那么就需要添加点图层;我们简单演示一个例子,代码如下
var graphicsLayer = new GraphicsLayer();
map.add(graphicsLayer);
var point = {type: "point",longitude: 121.38445719,latitude: 31.77367695
};var simpleMarkerSymbol = {type: "picture-marker",url: "/content/images/svg/icon_address.svg",width: "30px",height: "30px",color: [226, 119, 40],  // orangeoutline: {color: [255, 255, 255], // whitewidth: 1},
};
let pointGraphic = new Graphic({geometry: point,symbol: simpleMarkerSymbol
});
graphicsLayer.add(pointGraphic);
1>定义一个GraphicsLayer的图层;然后添加到map里面;
2>定一个pointGraphic:Graphic,然后添加到graphicsLayer里面,这个pointGraphic通过一个点和simpleMarkerSymbol来构造;效果图如下所示
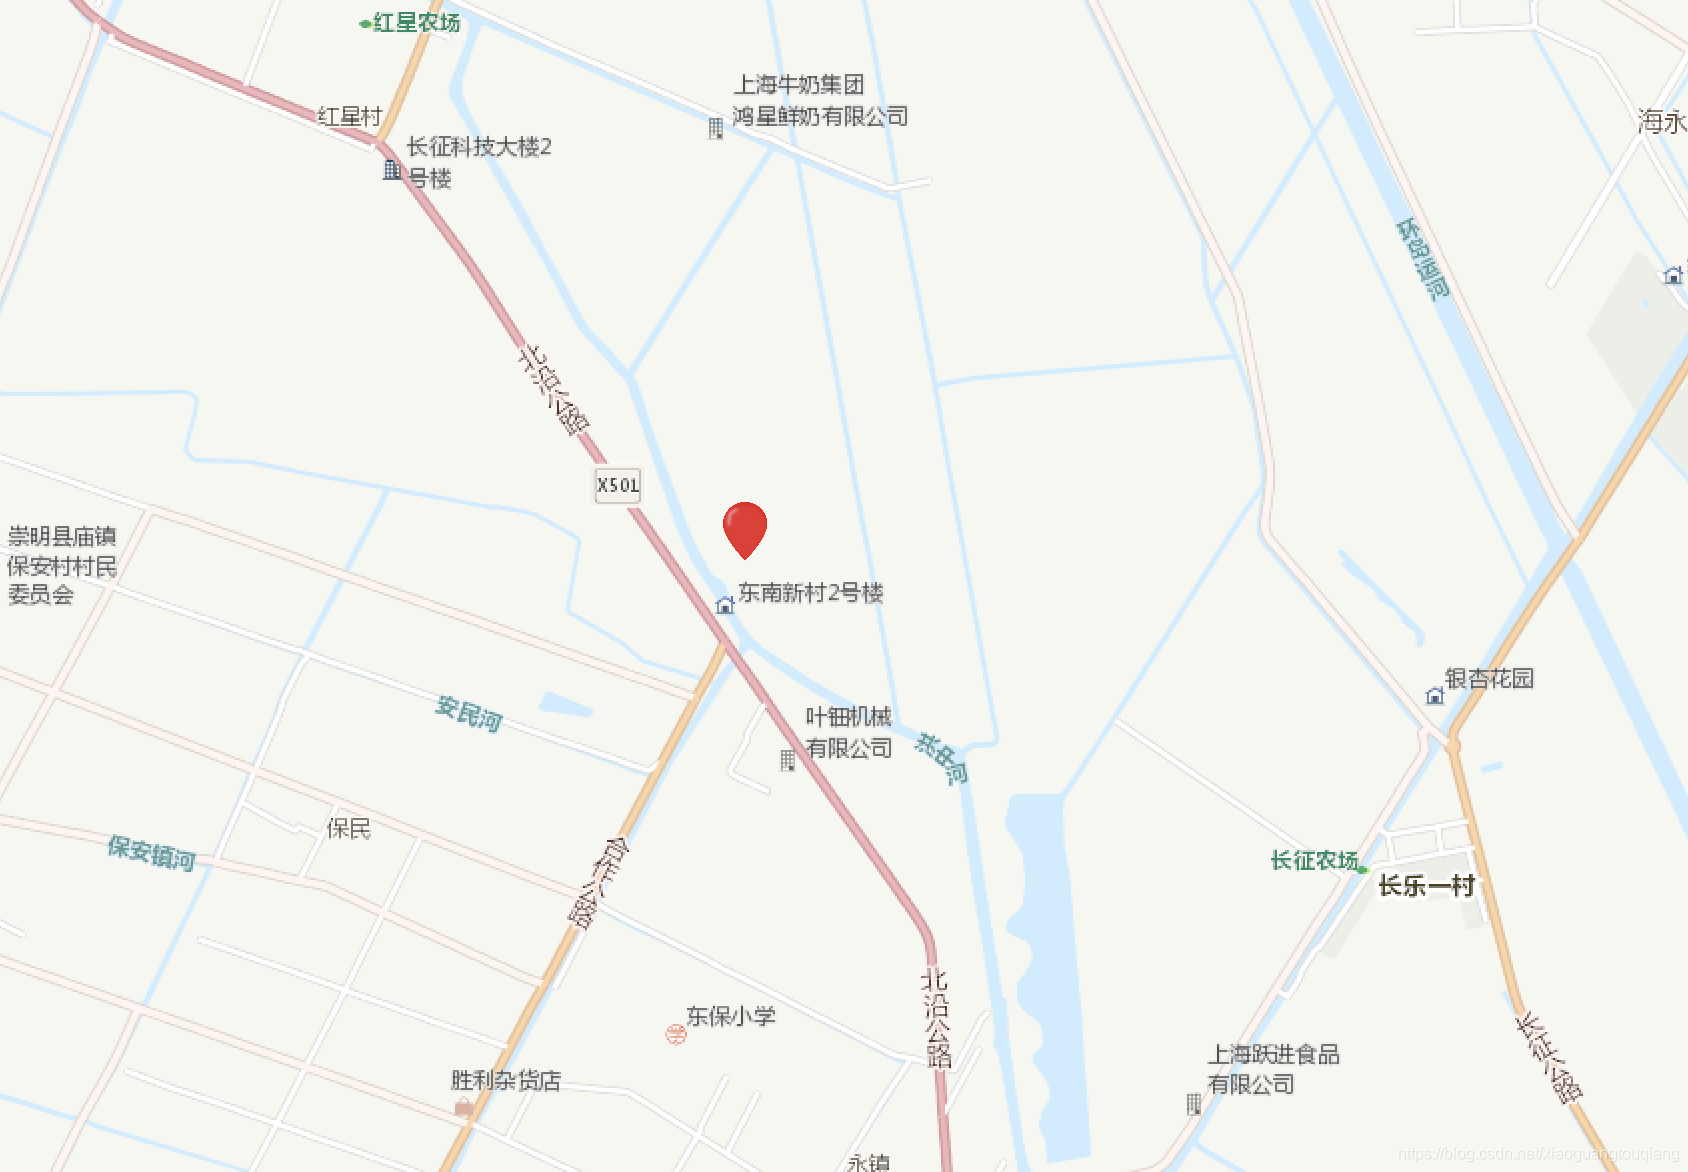
这里simpleMarkerSymbol主要是为了显示这个点的图标;是自定义的一个svg;
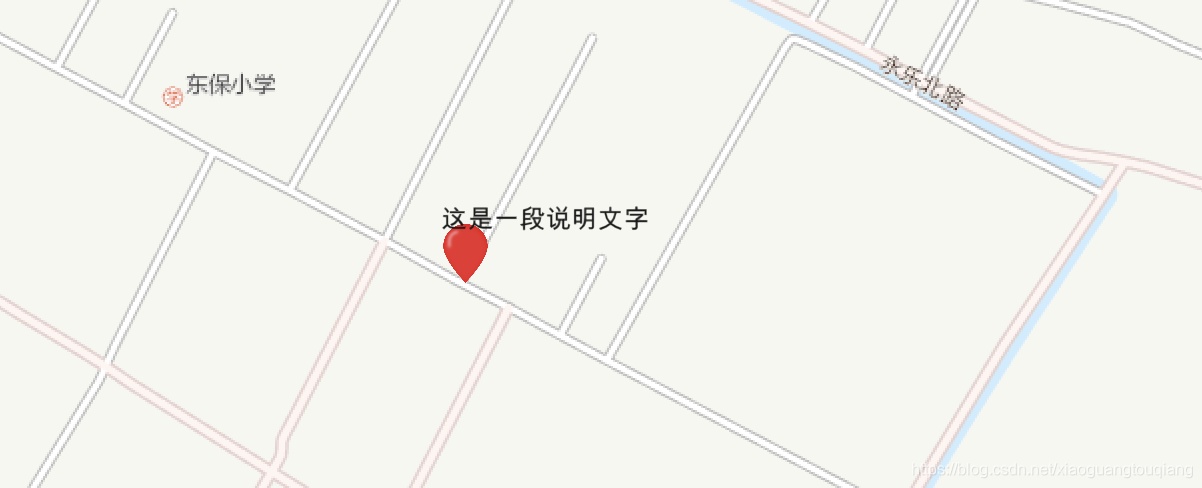
4.有时候需要在点上添加文字,那么需要再定义一个textGraphic;用来标示点的一些说明文字
var textGraphic = new Graphic({geometry: {type: "point",longitude: 121.38445719,latitude: 31.77367695},symbol: {type: "text",borderLineColor: [255,0,0,255],borderLines: 10,color: [25,25,25],haloSize: 1,text: "这是一段说明文字",xoffset: 30,yoffset: 10,font: {size: 10}}
});
graphicsLayer.add(textGraphic);
然后同样添加到GraphicsLayer中;
效果如下所示
5.添加热力图
1>我们要添加一个featureLayer的图层;
const featureLayer = new FeatureLayer({source: this.featureData, //点数据集title: '热力图',objectIdField: 'ObjectID', //重要!!!renderer: heatmapRenderer //渲染器
});
map.add(featureLayer);
这里的objectIdField是点的唯一标示,在featureData中会体现出来;
2>这里面renderer是渲染器,定义如下所示
const heatmapRenderer = new HeatmapRenderer({colorStops: [{ratio: 0, color: 'rgba(255, 255, 255, 0)'},{ratio: 0.2, color: 'rgba(255, 255, 255, 1)'},{ratio: 0.5, color: 'rgba(255, 140, 0, 1)'},{ratio: 0.8, color: 'rgba(255, 140, 0, 1)'},{ratio: 1, color: 'rgba(255, 0, 0, 1)'}],blurRadius: 14,maxPixelIntensity: 50,minPixelIntensity: 0
});
3>this.featureData是热力图中的点的数据;格式如下所示
[{"geometry": {"type": "point","x": 121.22,"y": 31.31},"attributes": {"ObjectID": 1}},{"geometry": {"type": "point","x": 121.12,"y": 31.34},"attributes": {"ObjectID": 2}}]
ok,基本arcgis的总结就到这里,只是一些入门的知识,后面持续补充吧
本文来自互联网用户投稿,文章观点仅代表作者本人,不代表本站立场,不承担相关法律责任。如若转载,请注明出处。 如若内容造成侵权/违法违规/事实不符,请点击【内容举报】进行投诉反馈!