Python项目【杭州房价数据分析】—— 爬虫、数据库、数据可视化[完整版]
给出GitHub链接 click here
一、通过Scrapy框架获取数据
(1)、设置item
class HangzhouHouseItem(scrapy.Item):# define the fields for your item here like:name = scrapy.Field()# 存放名字district = scrapy.Field()# 存放城市区域,上城区、下城区。。。。loc = scrapy.Field()# 具体位置area = scrapy.Field()# 面积price = scrapy.Field()# 价格(元/m^2)danwei = scrapy.Field()# 价格单位
(2)、price.py
这部分是获取数据的主要、核心部分。
我爬取的连接是here
首先,我们来看下这个网页界面。

每一个红色方框就是一个独立的例子,我们主要爬取的是黄色的部分,主要包括:小区名字、区、地址、价格这几个方面。
*1、获取这一页的所有房子
我使用的是chrome浏览器,在这个网页上,首先按住F12,然后按下图操作:

我们首先点按钮1,我们可以看到每一个小区都对应右边代码...。
所以我们需要选出这一页所有的房子。
我们可以使用下面代码实现:
base_url = 'https://hz.focus.cn/loupan/p'
house_list = response.xpath('//div[@class="s-lp-all "]')
*2、小区名字
对每一个房子,在这个网页上,首先按住F12,然后按下图操作:

按照步骤1–》步骤2–》步骤三–》,我们关键看步骤三,我们可以看到,这个小区的名字在
的标签下的 标签中的字符串中,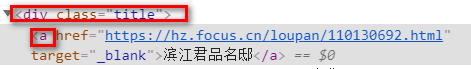
所以我们使用下面的代码实现:
name = each.xpath('.//div[@class="title"]/a/text()').extract()
*3、区位+地址
同样按照小区名字的方式来提取信息

后面,需要将区位和具体的地址分离。
loc = each.xpath('.//p[@class="location"]/span/text()').extract()
*4、面积

这里,我在price.py文件中选取的是汉字+数字,后期处理。
area = each.xpath('.//span[@class="building-area"]/text()').extract()
*5、价格

price = each.xpath('.//span[@class="price"]/text()').extract()
后期也是要处理的,主要是因为有些给的价格是元每平方米,二有的是多少万元每栋的,所以单位要统一,我同意换成前者。
*6、单位

danwei = each.xpath('.//span[@class="danwei"]/text()').extract()
*7、将上面的数据放入到item中,来传输信息
item['name'] = name[0]
item['loc'] = loc[0]
item['area'] = area[0] if area else 'NAN'
item['price'] = price[0]
item['danwei'] = danwei[0] if danwei else 'NAN'
yield item
*8、获取多页爬取
for page in range(1, 25):url_ = ''.join([base_url,str(page), '/'])# print()# print('*' * 50)# print(url_)# print()next_request = Request(url_, callback=self.parse)yield next_request
(3)、pipeline.py
*1、这里主要是处理面积和价格。
对于面积来说,主要是通过提取的面积,来split,然后求取面积的范围的中位数。
对于价格,首先,是根据单位来处理,如果单位是元每平方米,就直接存放,否则就除以面积然后存放。
 # deal with area, get a number
if item['area'] != 'NAN':item['area'] = item['area'].split(':')[-1]item['area'] = item['area'][:-3]temp = item['area'].split('-')if len(temp) > 1:item['area'] = int((int(temp[0]) + int(temp[1])) / 2)else:item['area'] = temp[0]# for split district and loc
temp = item['loc'].split(' ')
item['district'] = temp[0]
item['loc'] = temp[1]# # deal with  price
# curr_danwei = item['danwei']
# if curr_danwei == ' 万元 / 套':
if re.search(r'.*万元 / 套.*', item['danwei']):if item['area'] == 'NAN':item['price'] = ' NAN'else:item['price'] = ' ' + str(int(item['price']) * 10000 // int(item['area']))# print('*************')
elif item['price'] == ' 待定':item['price'] = ' NAN'
*2、存入数据库
更详细的数据库连接,可以看这篇blog
self.cursor.execute("""insert into price(name_, district, loc, area, price)value (%s, %s, %s, %s, %s)""",(item['name'],item['district'],item['loc'],item['area'],item['price']))# 提交sql语句
self.connect.commit()
二、数据分析
(1)导入数据
import pymysql
import pandas as pddef load_data_from_sql(sql, host, db, user, passwd, charset ='utf8', use_unicode=True):"""load data frin mysql, and use pandas to store data"""# bulid connectcon = pymysql.connect(host=host,db=db,user=user,passwd=passwd,charset=charset,use_unicode=use_unicode)# build cursorcursor = con.cursor()house_price = pd.read_sql(sql, con)con.close()return house_priceif __name__ == '__main__':print(load_data_from_sql('select * from price', 'localhost', 'house_price_HZ', 'root', '123456'))
(2)清洗数据
import pandas as pd
import numpy as np
from load_data import load_data_from_sql# house_price.info()
def clearn_data():house_price = load_data_from_sql('select * from price', 'localhost', 'house_price_HZ', 'root', '5119550')# 选择有用的信息df = pd.DataFrame(house_price, columns=['name_', 'district', 'area', 'price'])# latitude dictlat_dict = {'上城': [120.17, 30.25], '下城': [120.17, 30.28], '拱墅': [120.13, 30.32],'西湖': [120.13, 30.27], '滨江': [120.20, 30.20], '萧山': [120.27, 30.17],'余杭': [120.30, 30.42], '桐庐': [119.67, 29.80], '淳安': [119.03, 29.60],'建德': [119.28, 29.48], '江干': [120.21, 30.2572], '富阳': [119.95, 30.05],'临安': [119.72, 30.23], '金华': [119.65, 29.09],'海宁': [120.68, 30.51],'湖州': [120.10, 30.87]}# a = df.groupby('district')# # print(type(df['price'][0]))df['price'] = pd.to_numeric(df['price'], errors='coerce')df['area'] = pd.to_numeric(df['area'], errors='coerce')# # print(type(df['price'][0]))# avg_price_each_dis = dict(a['price'].agg(np.mean))### val = df['price'].isnull()# print(avg_price_each_dis)# 下面实现缺省值用同一district的均值填充,这个代码要领会# 需要处理的列cols = ['area', 'price']# 分组的列gp_col = 'district'# 查询对应列的nandf_na = df[cols].isnull()# 根据分组计算均值df_mean = df.groupby(gp_col)[cols].mean()# print(df.tail())for col in cols:na_saries = df_na[col]districts_ = list(df.loc[na_saries, gp_col])# print(districts_)t = df_mean.loc[districts_, col]t.index = df.loc[na_saries, col].indexdf.loc[na_saries, col] = treturn dfif __name__ == '__main__':df = clearn_data()print(df.tail())
(3)绘图分析
import pandas as pd
from clearn_data import clearn_data
import matplotlib.pyplot as plt
from pylab import mpl
import pyecharts
mpl.rcParams['font.sans-serif'] = ['simhei'] # 指定默认字体
mpl.rcParams['axes.unicode_minus'] = False # 解决保存图像是负号'-'显示为方块的问题df = clearn_data()
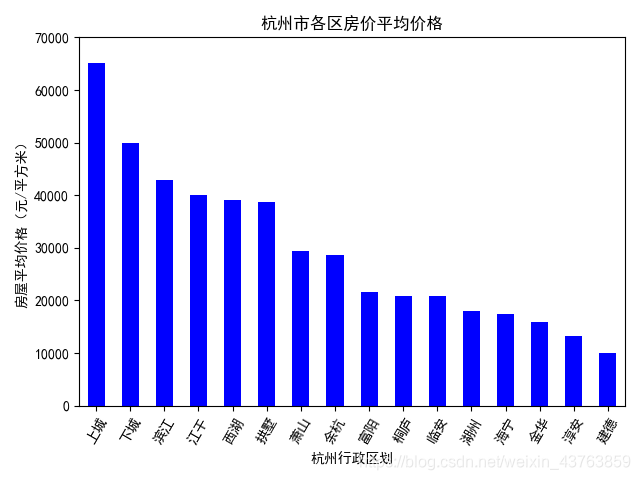
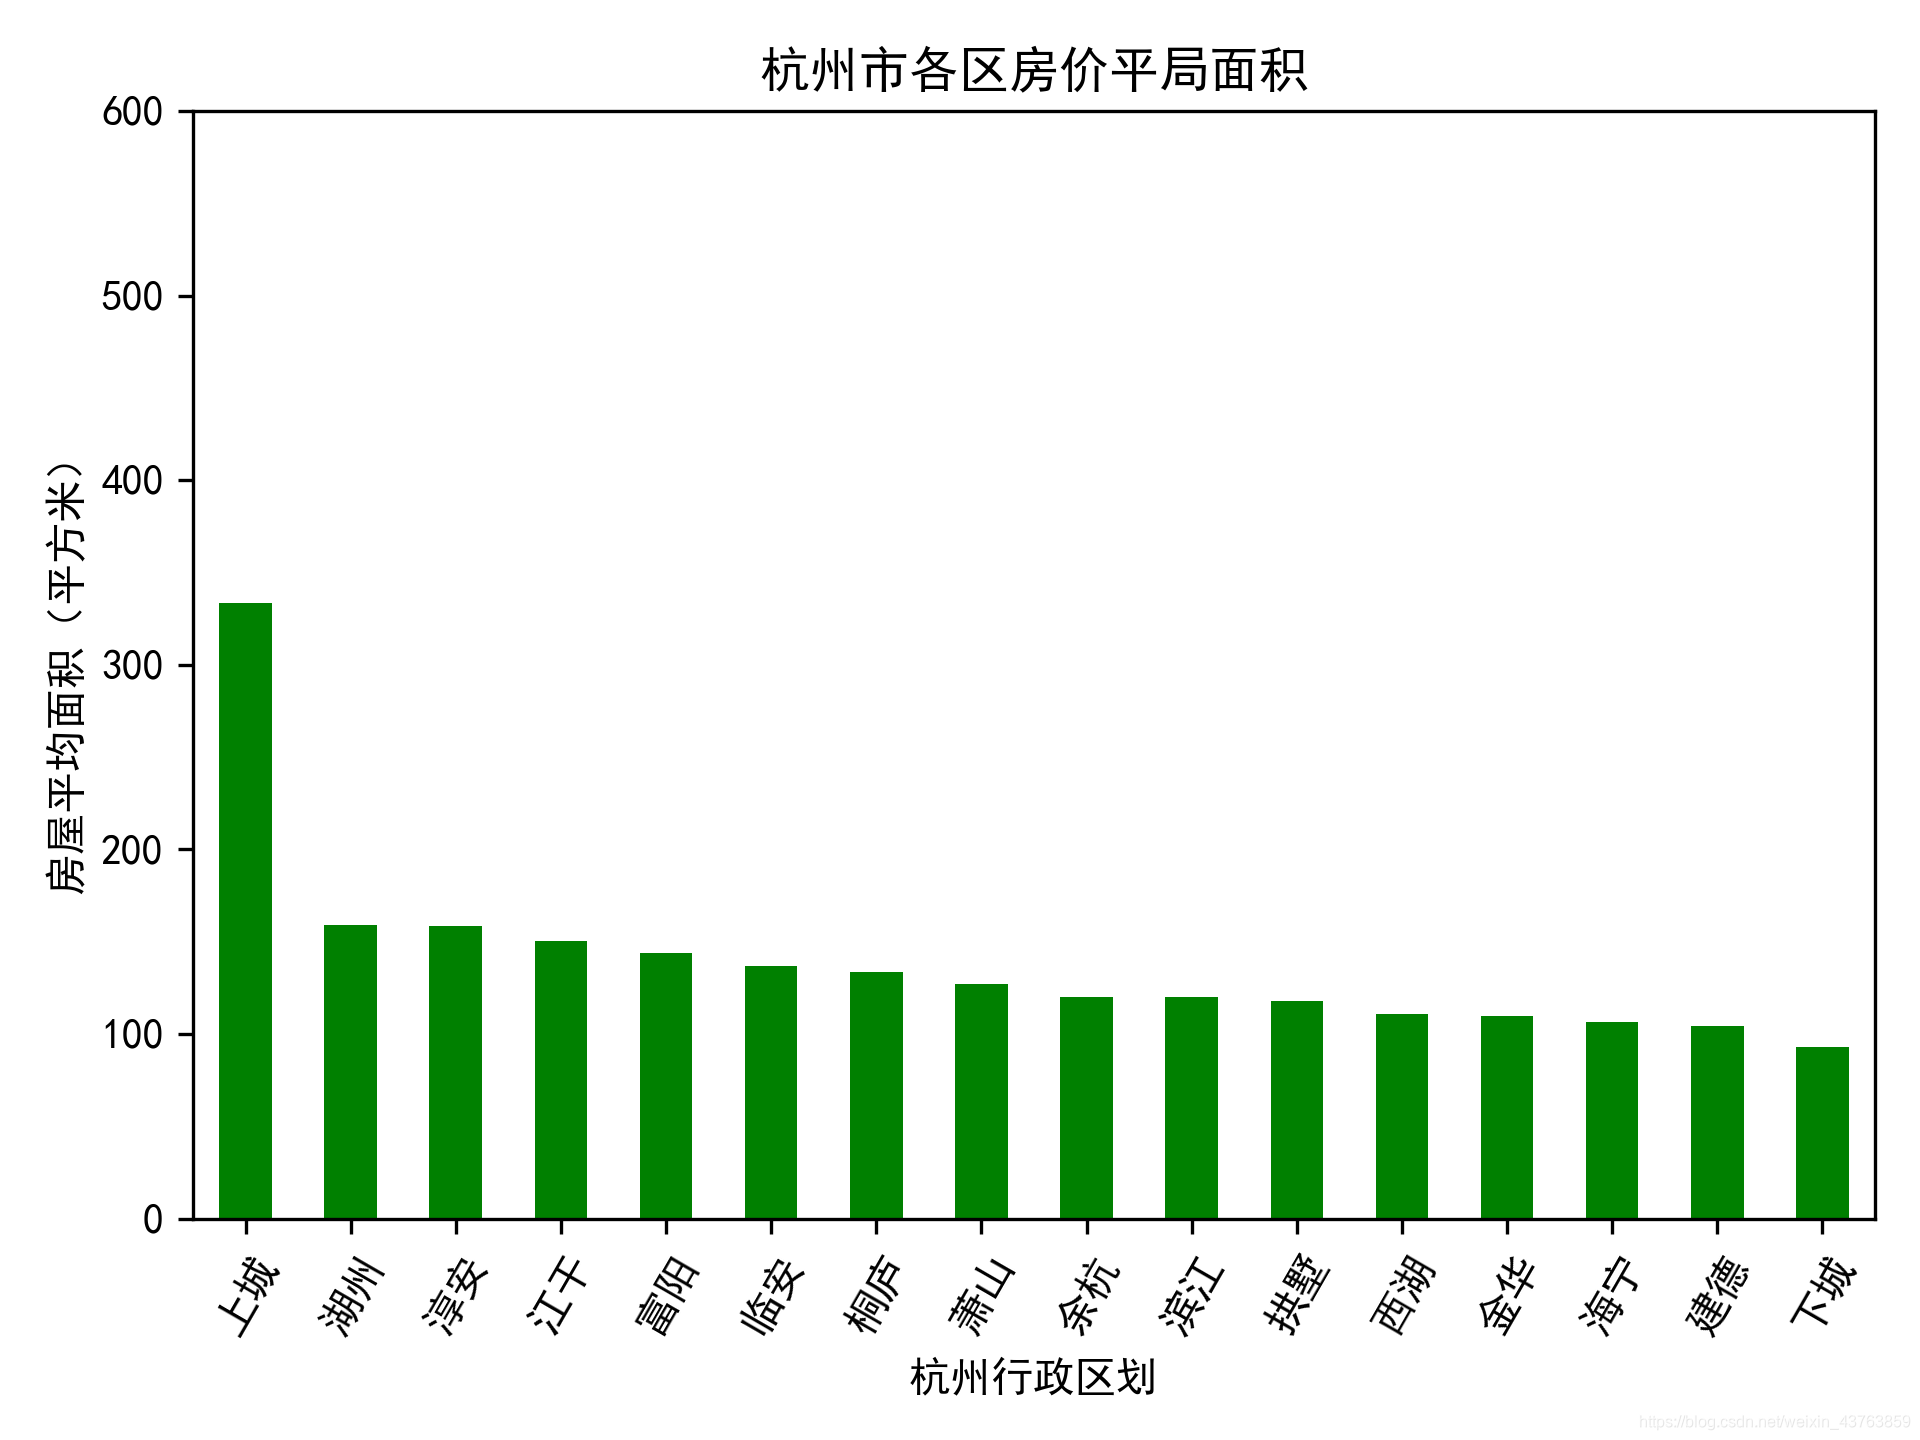
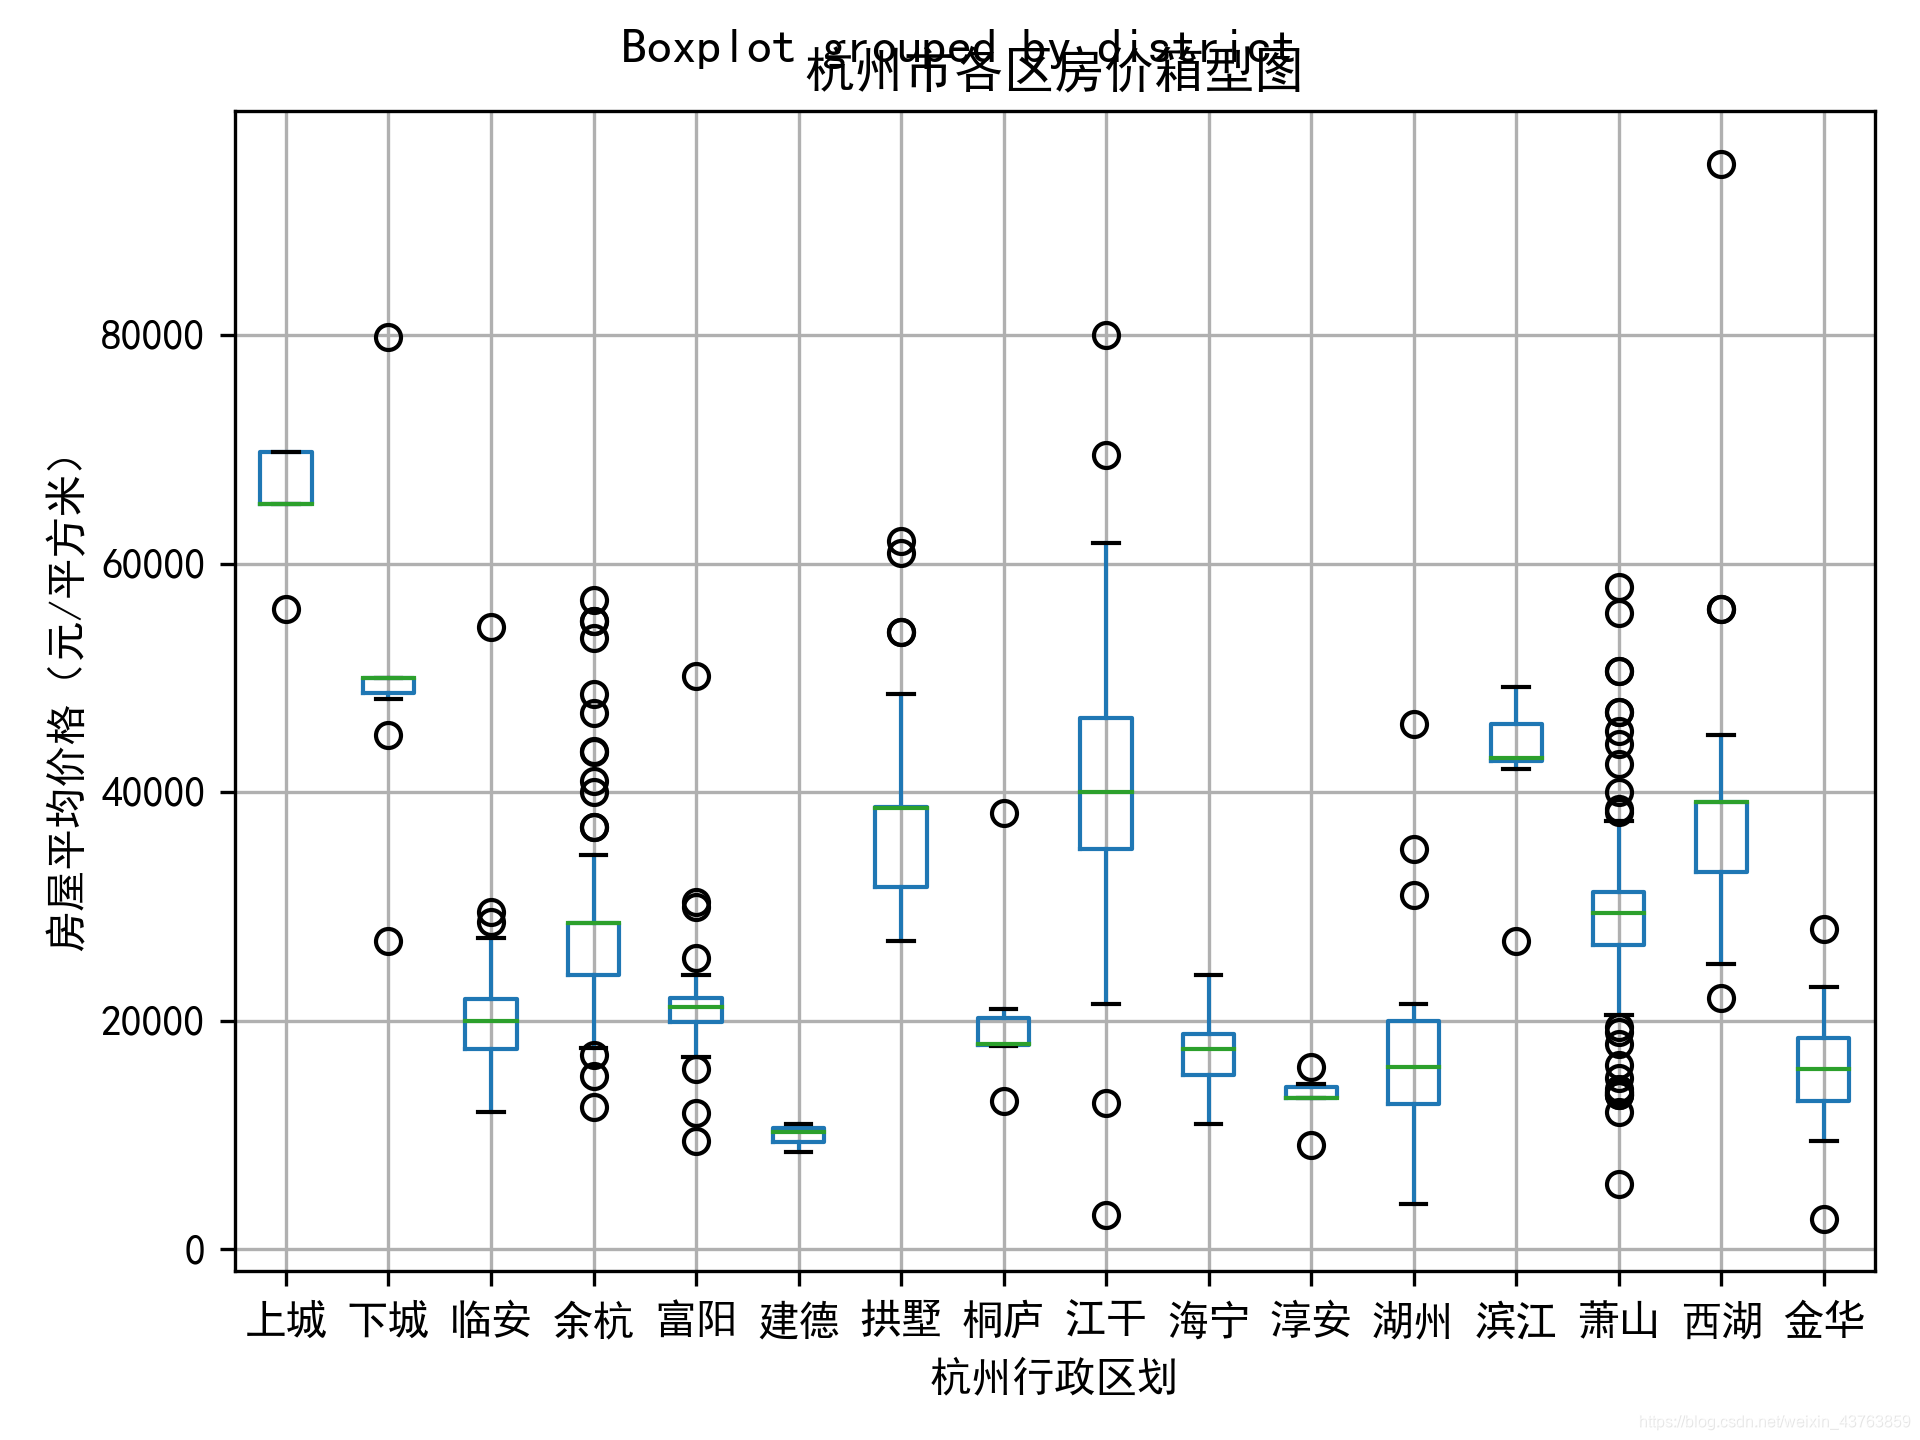
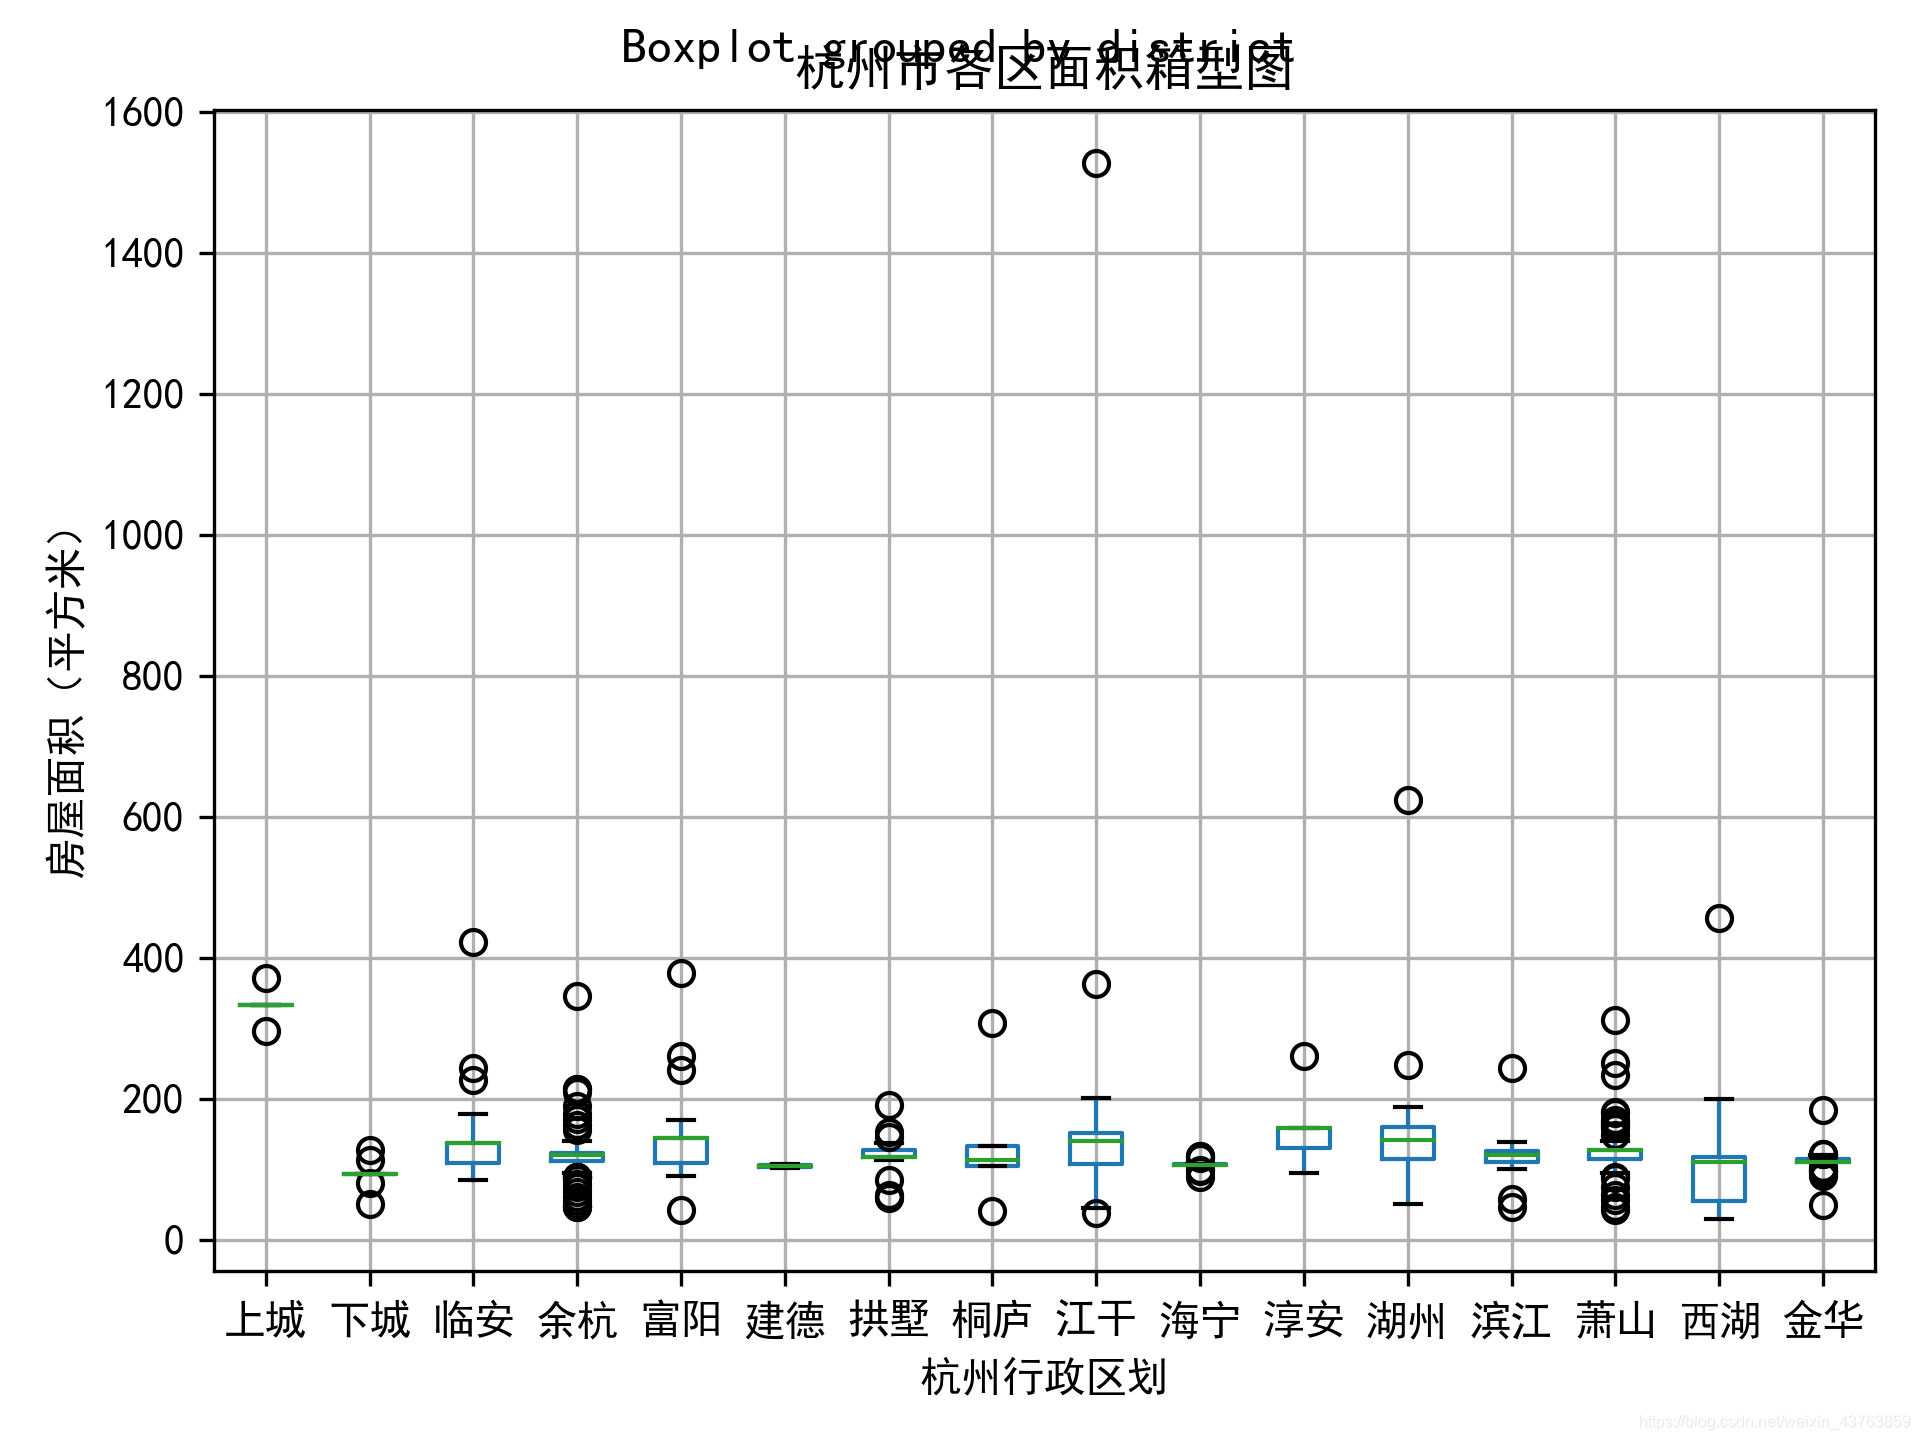
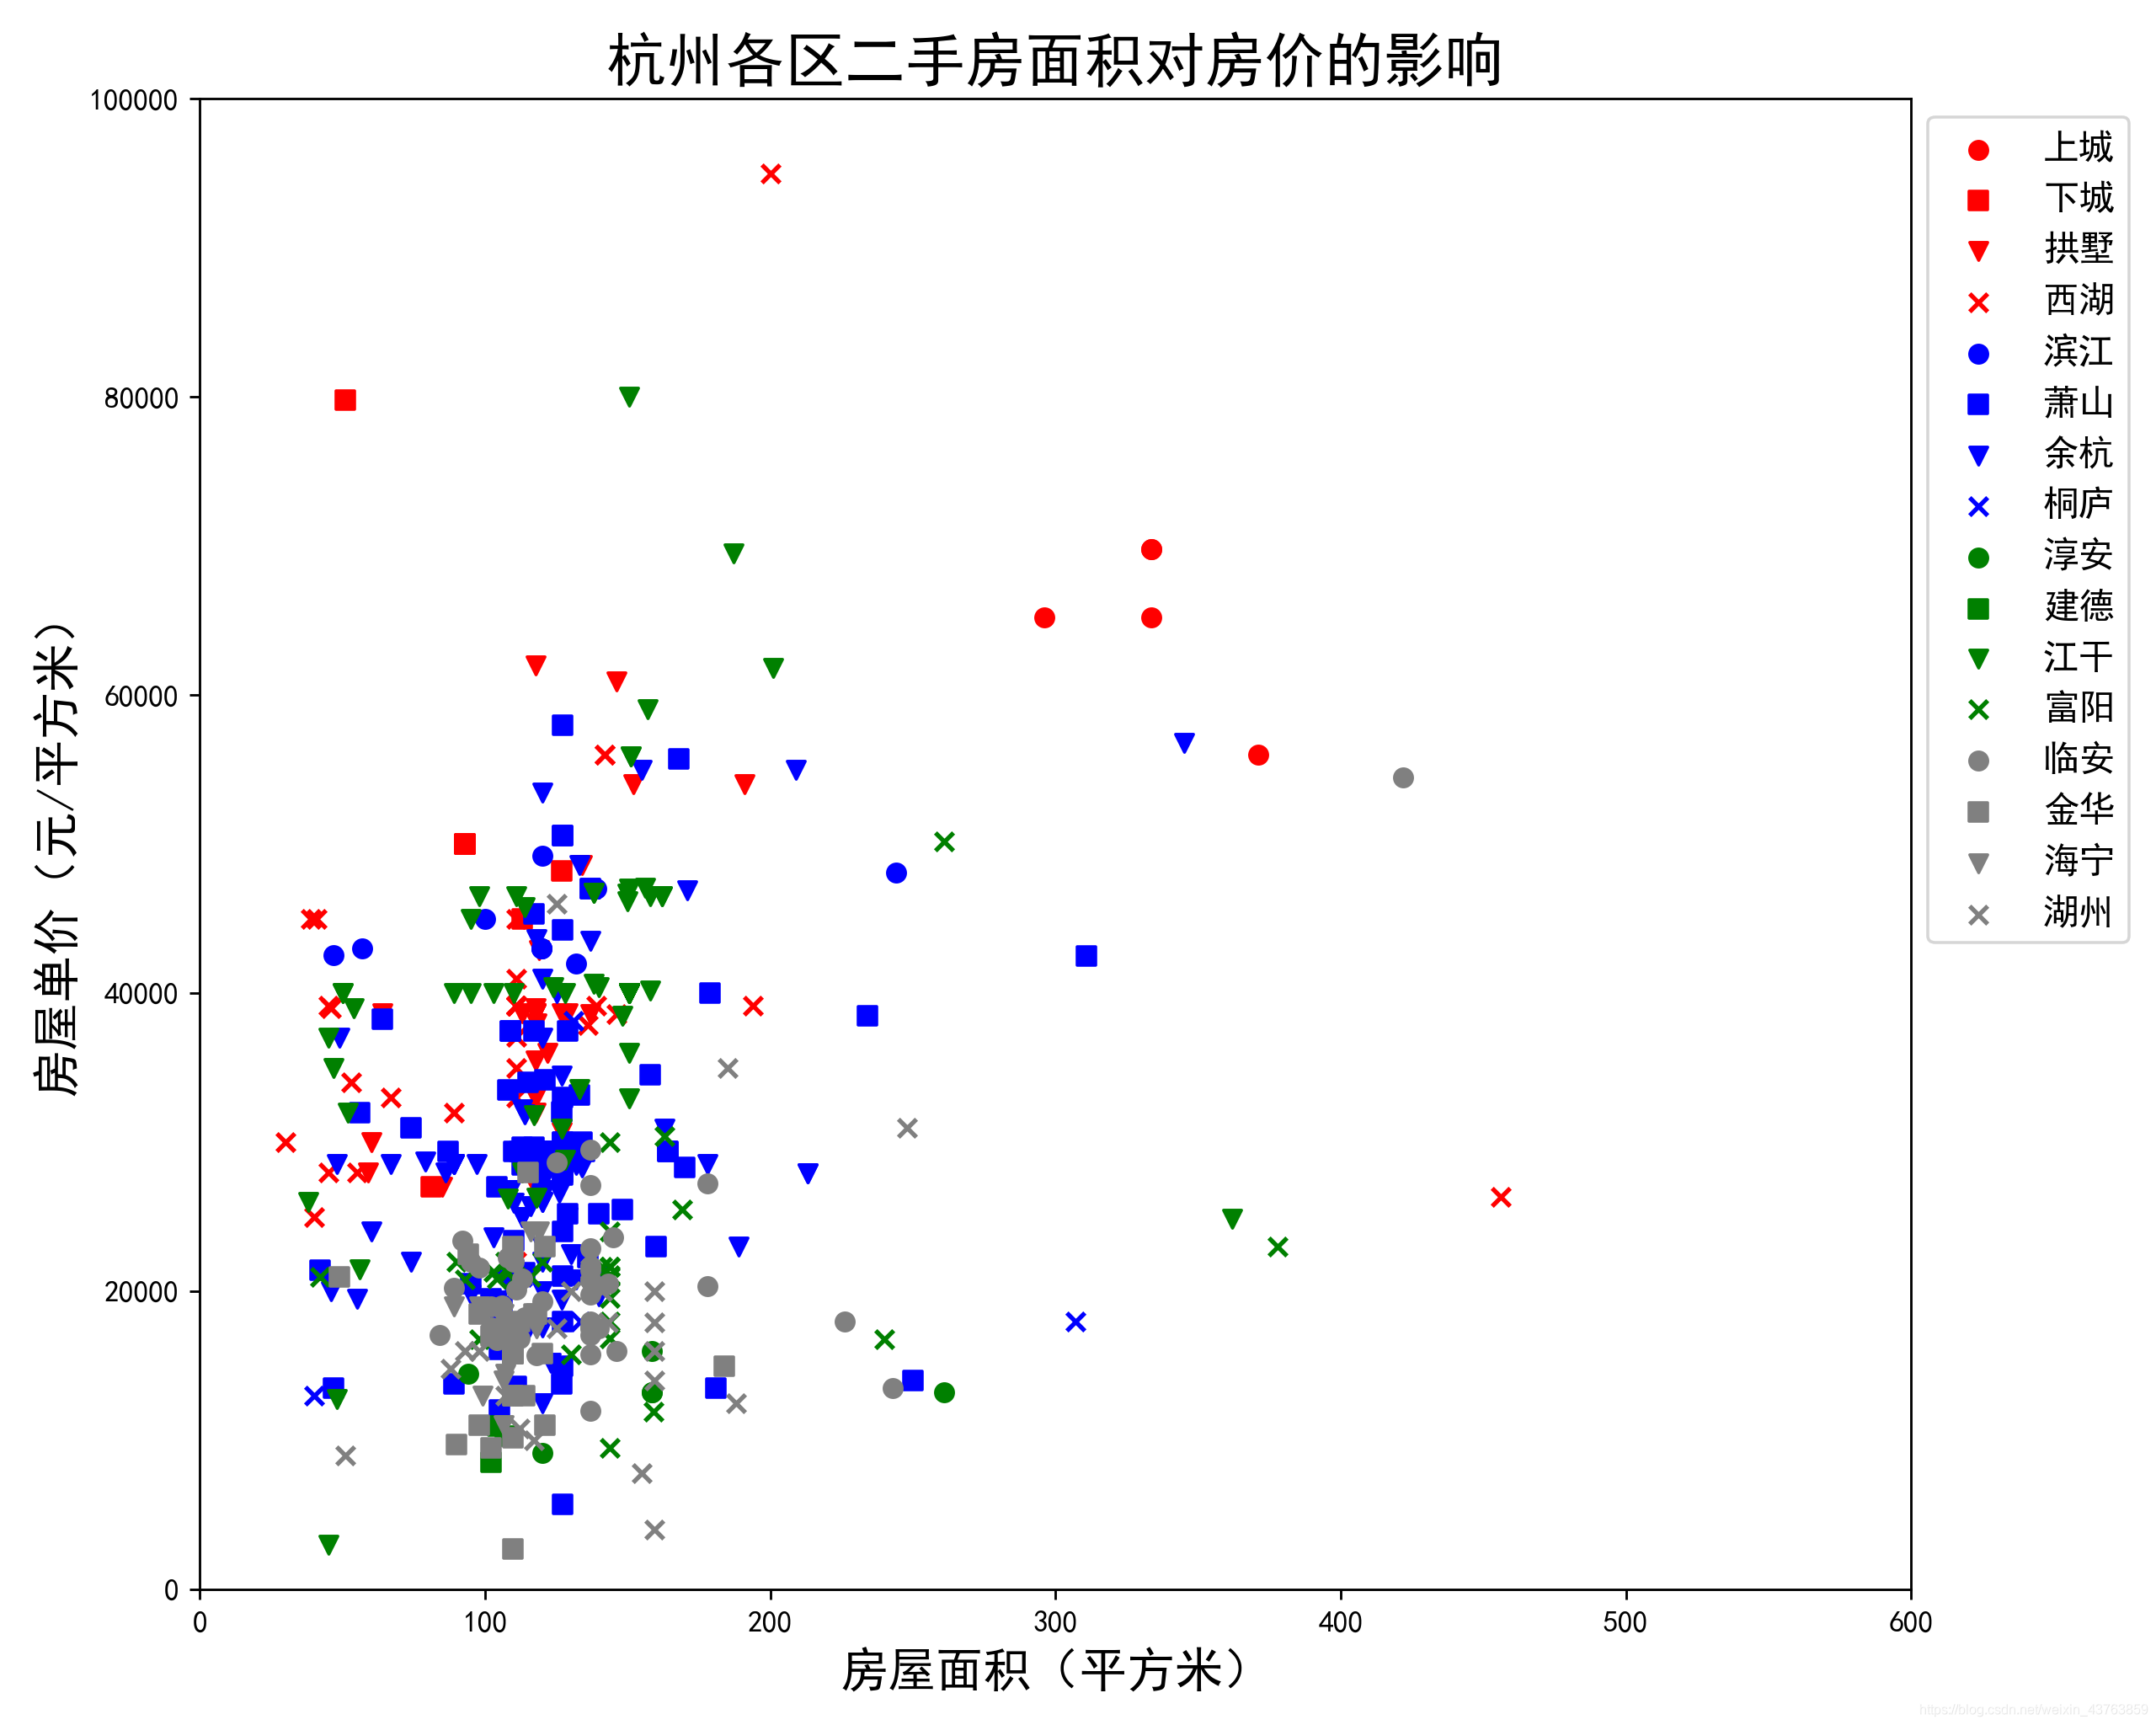
# print(df.tail())def plot_district_(type = 'price'):"""绘制区域与价格或面积图. type = 'price' 或者 ‘area’"""each_dist_price = df.groupby('district')['price'].mean().sort_values(ascending=False)each_dist_area = df.groupby('district')['area'].mean().sort_values(ascending=False)if type == 'price':each_dist_price.plot(kind='bar',color='b')plt.ylim(0,70000,10000)plt.title("杭州市各区房价平均价格")plt.ylabel("房屋平均价格(元/平方米)")elif type == 'area':each_dist_area.plot(kind='bar', color= 'g')plt.ylim(0, 600, 100)plt.title('杭州市各区房价平局面积')plt.ylabel('房屋平均面积(平方米)')plt.xlabel("杭州行政区划")plt.xticks(rotation = 60)plt.rcParams['figure.dpi'] = 300plt.show()def plot_box_district_(type = 'price'):"""箱型图"""if type == 'price':df.boxplot(column = 'price', by='district')plt.title('杭州市各区房价箱型图')plt.ylabel("房屋平均价格(元/平方米)")elif type == 'area':df.boxplot(column = 'area', by ='district')plt.title('杭州市各区面积箱型图')plt.ylabel('房屋面积(平方米)')plt.xlabel("杭州行政区划")plt.show()def plot_scatter():plt.figure(figsize=(10,8),dpi=256)colors = ['red', 'red', 'red', 'red','blue', 'blue', 'blue', 'blue','green', 'green', 'green', 'green','gray', 'gray', 'gray', 'gray']addr_dist = ['上城','下城','拱墅','西湖','滨江','萧山','余杭','桐庐','淳安', '建德','江干','富阳','临安','金华', '海宁', '湖州']markers = ['o','s','v','x','o', 's', 'v', 'x','o', 's', 'v', 'x','o', 's', 'v', 'x']for i in range(len(addr_dist)):x = df.loc[df['district'] == addr_dist[i]]['area']y = df.loc[df['district'] == addr_dist[i]]['price']plt.scatter(x, y, c = colors[i], label = addr_dist[i], marker=markers[i])plt.legend(loc=1, bbox_to_anchor=(1.138, 1.0), fontsize=12)plt.xlim(0, 600)plt.ylim(0, 100000)plt.title('杭州各区二手房面积对房价的影响', fontsize=20)plt.xlabel('房屋面积(平方米)', fontsize=16)plt.ylabel('房屋单价(元/平方米)', fontsize=16)plt.show()print(df['area'].max())# plot_scatter()# c = df.loc[:, 'price']
# print(c)
# fre = df.price.apply(lambda x: 1 if 0 < x < 20000 else 0).sum()
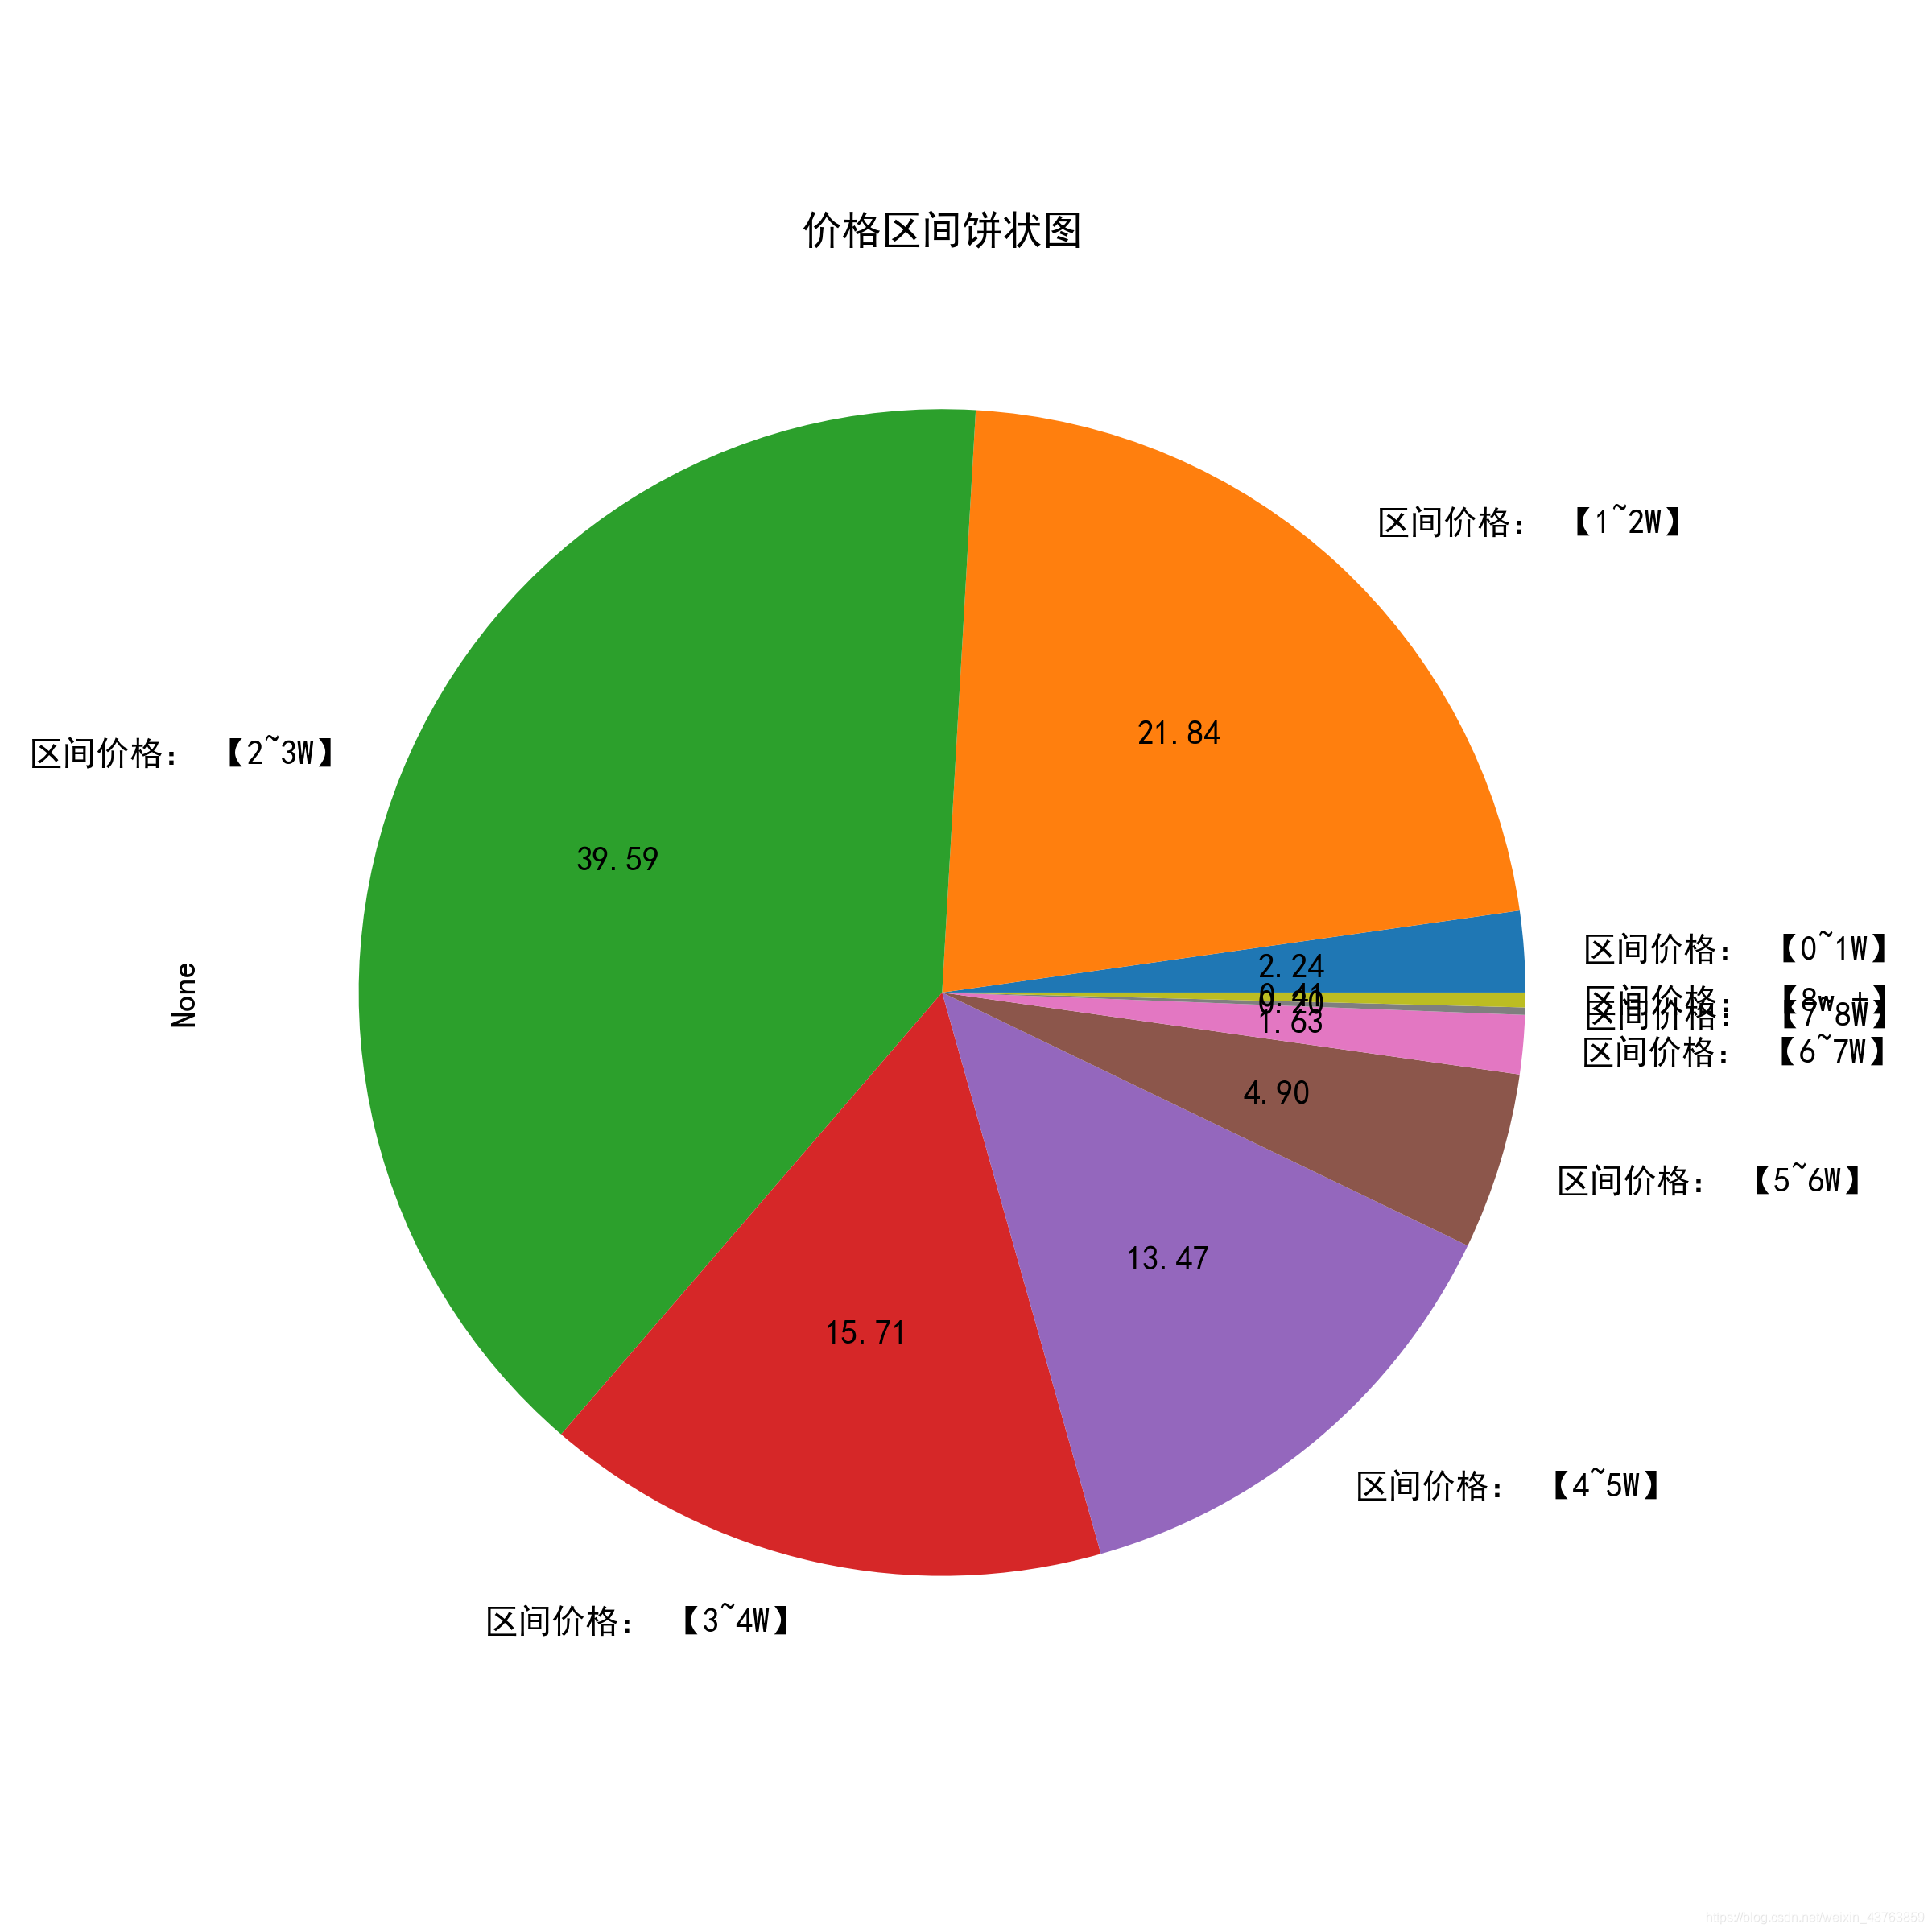
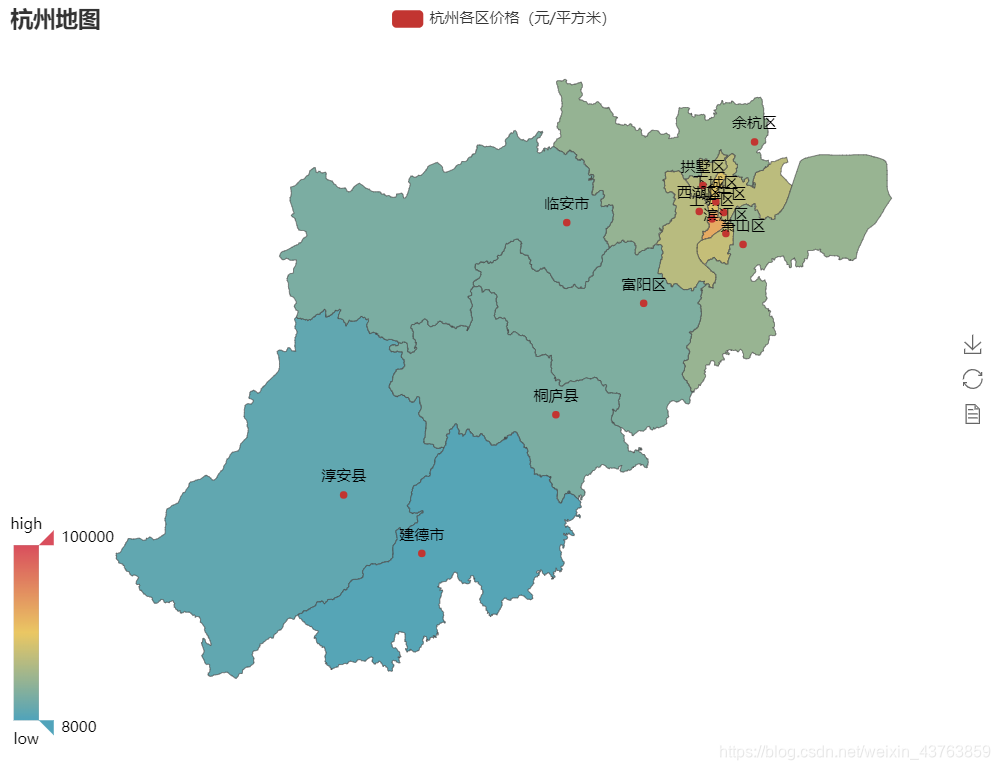
# print(fre)def pie_price():# level_price = {'区间价格: 【0~1W】': 0,# '区间价格: 【1~2W】': 0,# '区间价格: 【2~3W】': 0,# '区间价格: 【3~4W】': 0,# '区间价格: 【4~5W】': 0,# '区间价格: 【5~6W】': 0,# '区间价格: 【6~7W】': 0,# '区间价格: 【7~8W】': 0}level_price = pd.Series()def count_range(low = None, high = None):if not high:fre_num = df.price.apply(lambda x: 1 if low <= x else 0).sum()elif not low:fre_num = df.price.apply(lambda x: 1 if x < high else 0).sum()elif high and low:fre_num = df.price.apply(lambda x: 1 if low <= x < high else 0).sum()else:print('please enter right number')return fre_numlevel_price['区间价格: 【0~1W】'] = count_range(0, 10000)level_price['区间价格: 【1~2W】'] = count_range(10000, 20000)level_price['区间价格: 【2~3W】'] = count_range(20000, 30000)level_price['区间价格: 【3~4W】'] = count_range(30000, 40000)level_price['区间价格: 【4~5W】'] = count_range(40000, 50000)level_price['区间价格: 【5~6W】'] = count_range(50000, 60000)level_price['区间价格: 【6~7W】'] = count_range(60000, 70000)level_price['区间价格: 【7~8W】'] = count_range(70000, 80000)level_price['区间价格: 【8w +】'] = count_range(80000)# print(level_price)level_price.plot.pie(figsize=(8, 8), autopct='%.2f')plt.title('价格区间饼状图')plt.show()def map_price():group_price = df.groupby('district')['price'].mean()districts = ['上城区', '下城区', '临安市', '余杭区', '富阳区','建德市', '拱墅区', '桐庐县', '江干区', '淳安县','滨江区', '萧山区', '西湖区']# print(group_price)prices = [65200, 50000, 20738, 28540, 21672,9940, 38660, 20780, 40040, 13222,42981, 29399, 39175]map = pyecharts.Map('杭州地图', width=800, height=600)map.add('杭州各区价格(元/平方米)', districts, prices, visual_range=[8000, 100000],maptype='杭州', is_visualmap=True, visual_text_color='#000', is_label_show=True)map.render('HZ-Price.html')if __name__ == '__main__':# print(pyecharts.__version__)# map_price()pass
效果图:
有什么建议欢迎指出。
本文来自互联网用户投稿,文章观点仅代表作者本人,不代表本站立场,不承担相关法律责任。如若转载,请注明出处。 如若内容造成侵权/违法违规/事实不符,请点击【内容举报】进行投诉反馈!