plotly 图例(legend)设置
图例(legend)
import plotly.io as pio
import plotly.express as px
import plotly.graph_objects as go
from plotly.subplots import make_subplots
import pandas as pd
import numpy as np# 设置plotly默认主题
pio.templates.default = 'plotly_white'# 设置pandas打印时显示所有列
pd.set_option('display.max_columns', None)
update_layout(legend={}) 相关参数及示例
官方文档:https://plotly.com/python/reference/layout/#layout-showlegend
官方示例:https://plotly.com/python/legend/
- showlegend:是否显示图例,以下任一种情况发生时,该参数默认值为 True:1. 两个及两个以上的 trace 2. 有饼图3. 有一个 trace 显式指定
showlegend=True - legend:图例相关设置,字典类型,可取属性如下:
- bgcolor:设置图例的背景颜色
- bordercolor:设置图例边框的颜色
- borderwidth:设置图例边框的宽度
- font:设置图例条目的文本字体,字典类型,可取属性如下:
- color:字体颜色
- family:字体,字符串,可以为
Arial、Balto、Courier New、Droid Sans、Droid Serif、Droid Sans Mono、Gravitas One、Old Standard TT、Open Sans、Overpass、PT Sans Narrow、Raleway、Times New Roman - size:字体大小
- orientation:设置图例的方向。
'v'(默认值)表示竖直显示图例、'h'表示水平显示图例 - title:设置图例的标题,字典类型,可取属性如下:
- font:设置图例条目的文本字体,字典类型,可取属性如下:
- color:字体颜色
- family:字体,字符串,可以为
Arial、Balto、Courier New、Droid Sans、Droid Serif、Droid Sans Mono、Gravitas One、Old Standard TT、Open Sans、Overpass、PT Sans Narrow、Raleway、Times New Roman - size:字体大小
- side:设置图例标题相对于条目的位置。当
orientation='v'时默认为'top'、当orientation='h'时默认为'left'、当为'top left'时可用于扩展图例的面积 - text:设置图例标题
- font:设置图例条目的文本字体,字典类型,可取属性如下:
- grouptitlefont:设置图例组名的文本字体,字典类型,可取属性如下:
- color:字体颜色
- family:字体,字符串,可以为
Arial、Balto、Courier New、Droid Sans、Droid Serif、Droid Sans Mono、Gravitas One、Old Standard TT、Open Sans、Overpass、PT Sans Narrow、Raleway、Times New Roman - size:字体大小
- itemsizing:设置图例条目的符号是否跟其 ‘trace’ 有关,如果为
'constant',则所有条目的符号大小一致。- 可取
'trace'、'constant'
- 可取
- itemwidth:设置条目的宽度(除
title以外的部分)- 大于等于30的浮点数,默认值为30
- tracegroupgap:设置图例组之间的间隔
- 大于等于0的浮点数,默认值为10
- traceorder:设置图例条目的顺序。如果为
'normal',条目将从上到下按照输入数据的顺序排列;如果为'reversed',则按照输入数据的逆序排列;如果为'grouped',条目按照组顺序显示(如果 trace 中的legendgroup设定了);如果为'grouped+reversed',则与'grouped'的顺序相反 - valign:设置条目符号和对应文本的竖直对齐方式。
- 可取
'middle'(默认值)、'top'、'bottom'
- 可取
- x:设置图例的 x轴位置(归一化),当
orientation='v'时,默认值为 1.02;当orientation='h'时,默认值为0。[-2, 3] 之间的浮点数 - xanchor:设置图例水平位置的锚点,将
x绑定到图例的'left'(默认值)、'center'或'right'上,当为'auto'时,如果 x ≥ 2 3 x \ge \frac{2}{3} x≥32,则绑定到'right',如果 x ≤ 1 3 x \le \frac{1}{3} x≤31,则绑定到'left',其余情况绑定到'center' - y:设置图例的 y轴位置(归一化),当
orientation='v'时,默认值为 1;当orientation='h'且没有滑动条时,默认值为-0.1;当orientation='h'且有一个或多个滑动条时,默认值为1.1。[-2, 3] 之间的浮点数 - yanchor:设置图例竖直位置的锚点,将
y绑定到图例的'top'、'middle'或'bottom'上,当为'auto'时,如果 y ≤ 1 3 y \le \frac{1}{3} y≤31,则绑定到'bottom',如果 y ≥ 2 3 y \ge \frac{2}{3} y≥32,则绑定到'top',其余情况绑定到'middle'
df = px.data.gapminder().query("year==2007")
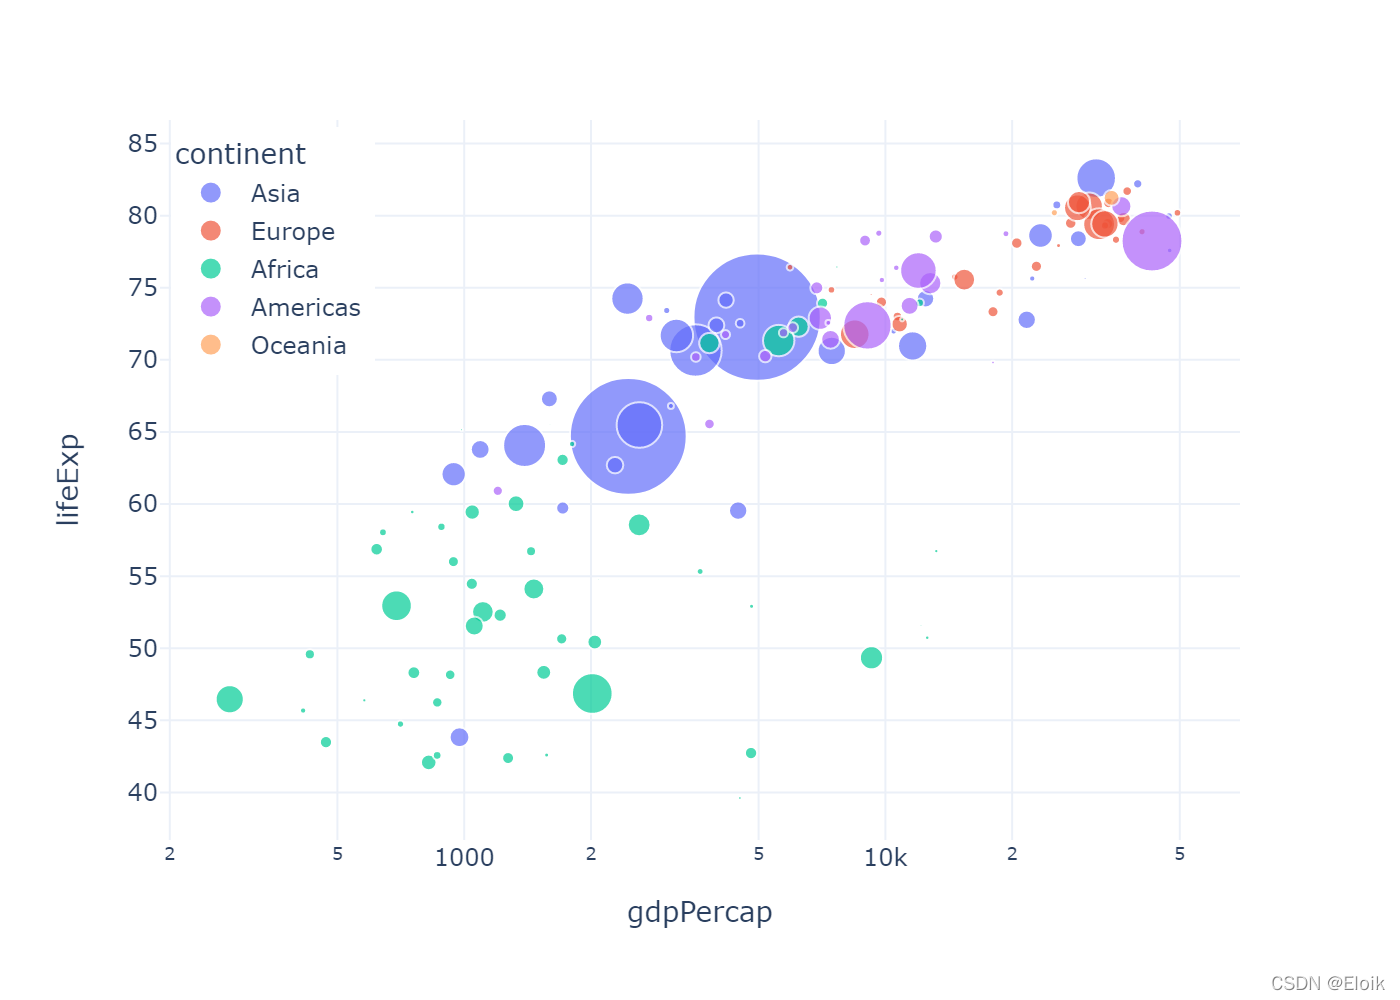
fig = px.scatter(df, x="gdpPercap", y="lifeExp", color="continent",size="pop", size_max=45, log_x=True)fig.update_layout(legend=dict(yanchor="top",y=0.99,xanchor="left",x=0.01
))fig.write_image('../pic/legend_1.png', scale=2)
fig.show()
df = px.data.gapminder().query("year==2007")
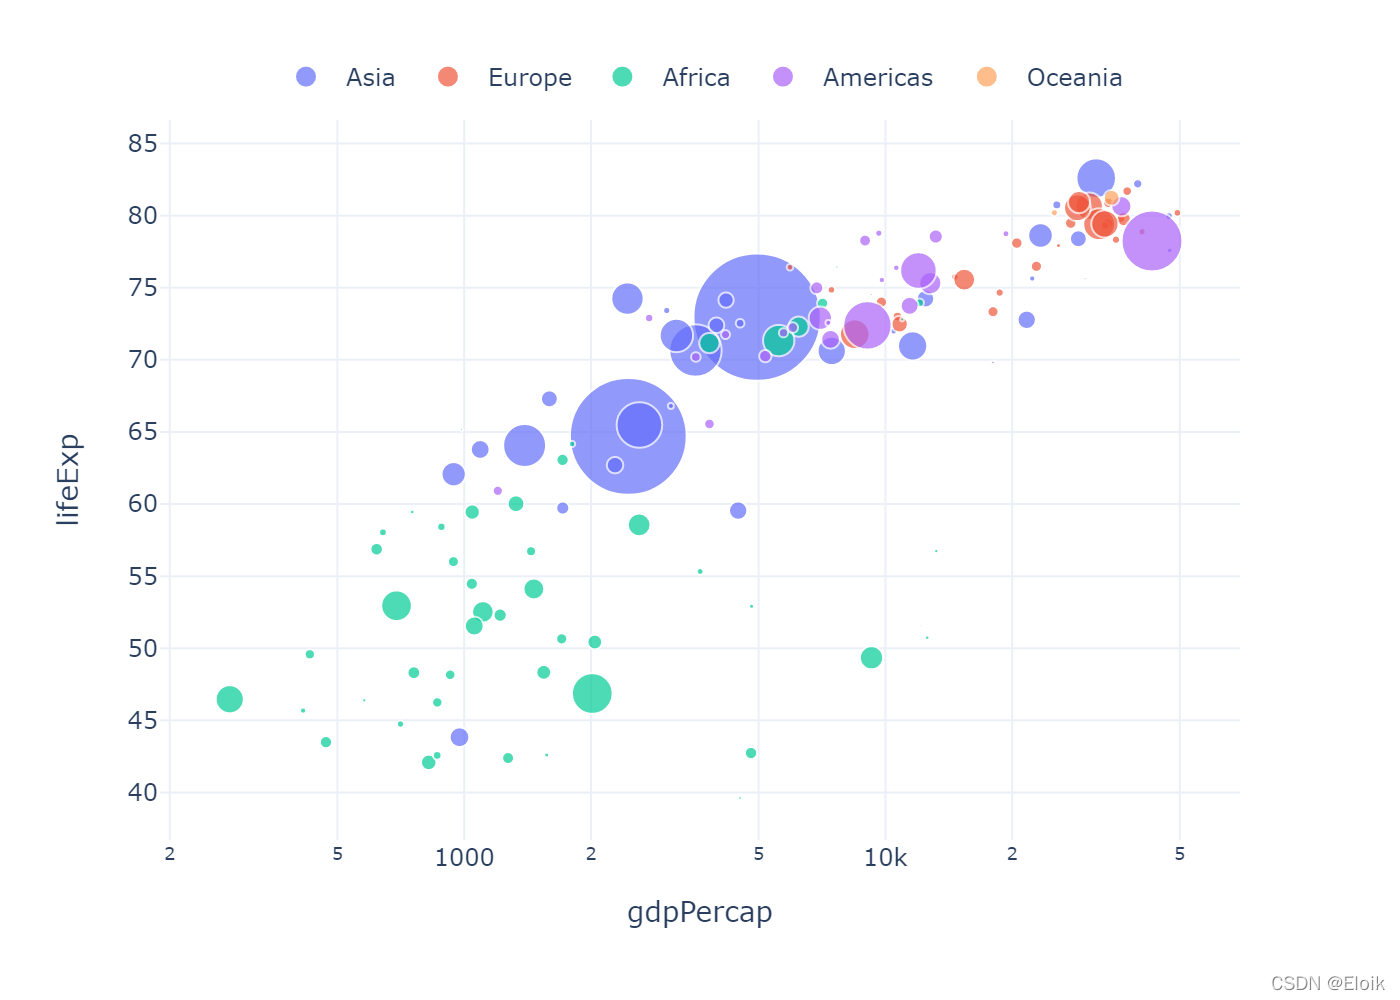
fig = px.scatter(df, x="gdpPercap", y="lifeExp", color="continent",size="pop", size_max=45, log_x=True)fig.update_layout(legend=dict(orientation="h",yanchor="bottom",y=1.02,xanchor="center",x=0.5,title_text=''
))fig.write_image('../pic/legend_2.png', scale=2)
fig.show()
df = px.data.gapminder().query("year==2007")
fig = px.scatter(df, x="gdpPercap", y="lifeExp", color="continent",size="pop", size_max=45, log_x=True)fig.update_layout(legend=dict(x=0,y=1,traceorder="reversed",title_font_family="Times New Roman",font=dict(family="Courier",size=12,color="black"),bgcolor="LightSteelBlue",bordercolor="Black",borderwidth=2)
)fig.write_image('../pic/legend_3.png', scale=2)
fig.show()
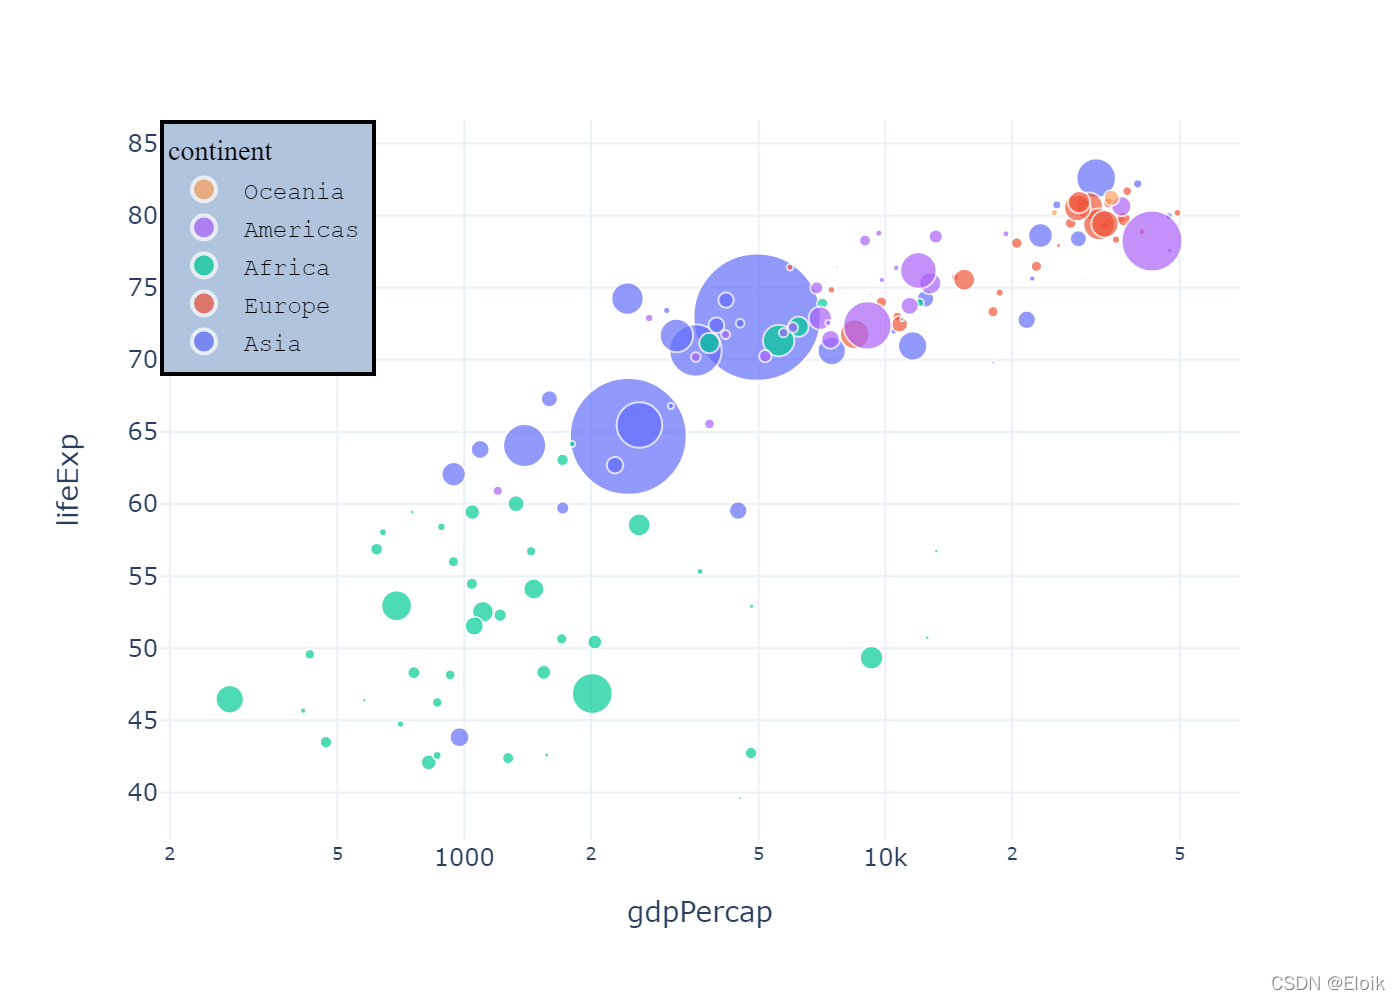
fig = go.Figure()# 使用 name 参数指定条目文本,legendrank 指定顺序
fig.add_trace(go.Bar(name="fourth", x=["a", "b"], y=[2,1], legendrank=4))
fig.add_trace(go.Bar(name="second", x=["a", "b"], y=[2,1], legendrank=2))
fig.add_trace(go.Bar(name="first", x=["a", "b"], y=[1,2], legendrank=1))
fig.add_trace(go.Bar(name="third", x=["a", "b"], y=[1,2], legendrank=3))fig.write_image('../pic/legend_4.png', scale=2)
fig.show()
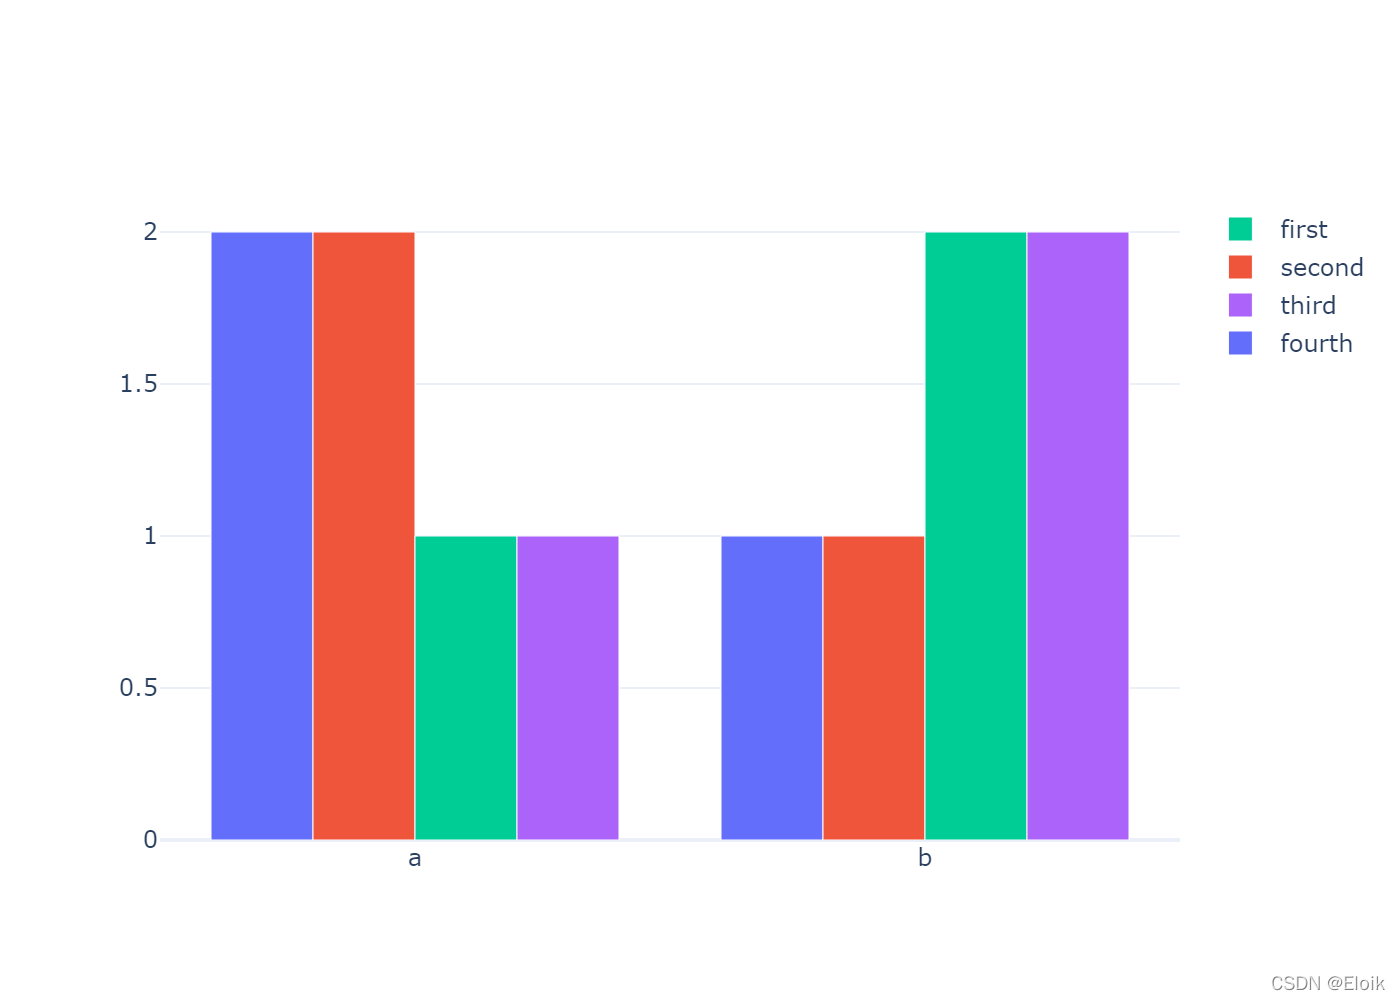
fig = go.Figure()fig.add_trace(go.Scatter(x=[1, 2, 3],y=[2, 1, 3],legendgroup="group",  # this can be any string, not just "group"legendgrouptitle_text="First Group Title",name="first legend group",mode="markers",marker=dict(color="Crimson", size=10)
))fig.add_trace(go.Scatter(x=[1, 2, 3],y=[2, 2, 2],legendgroup="group",name="first legend group - average",mode="lines",line=dict(color="Crimson")
))fig.add_trace(go.Scatter(x=[1, 2, 3],y=[4, 9, 2],legendgroup="group2",legendgrouptitle_text="Second Group Title",name="second legend group",mode="markers",marker=dict(color="MediumPurple", size=10)
))fig.add_trace(go.Scatter(x=[1, 2, 3],y=[5, 5, 5],legendgroup="group2",name="second legend group - average",mode="lines",line=dict(color="MediumPurple")
))fig.update_layout(title="Try Clicking on the Legend Items!")fig.write_image('../pic/legend_5.png', scale=2)
fig.show()
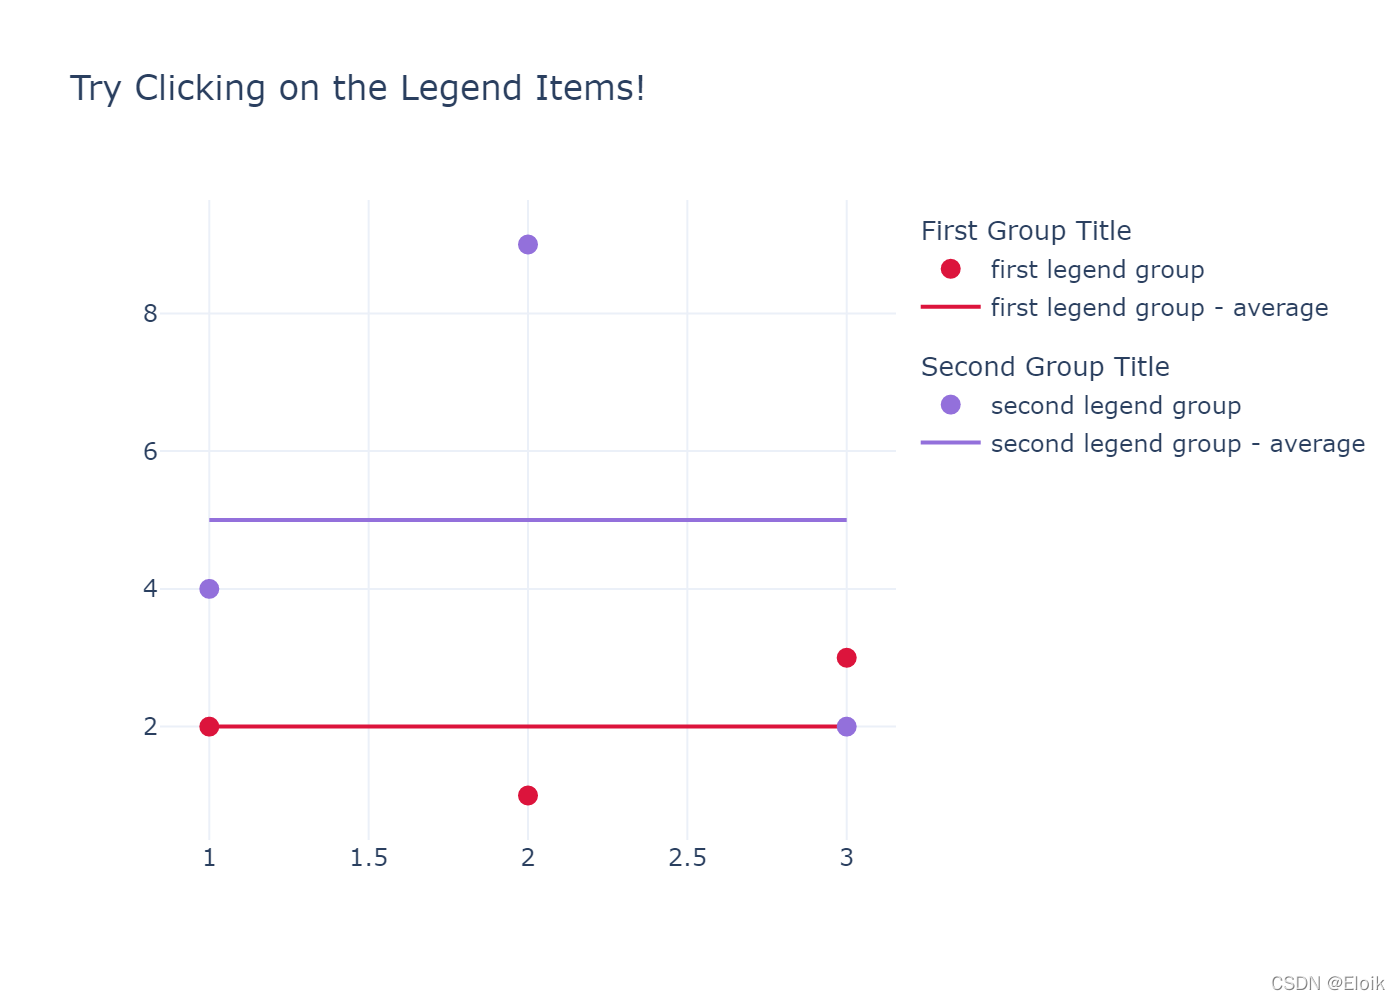
fig = go.Figure()fig.add_trace(go.Scatter(x=[1, 2, 3, 4, 5],y=[1, 2, 3, 4, 5],
))fig.add_trace(go.Scatter(x=[1, 2, 3, 4, 5],y=[5, 4, 3, 2, 1],visible='legendonly'
))fig.write_image('../pic/legend_6.png', scale=2)
fig.show()
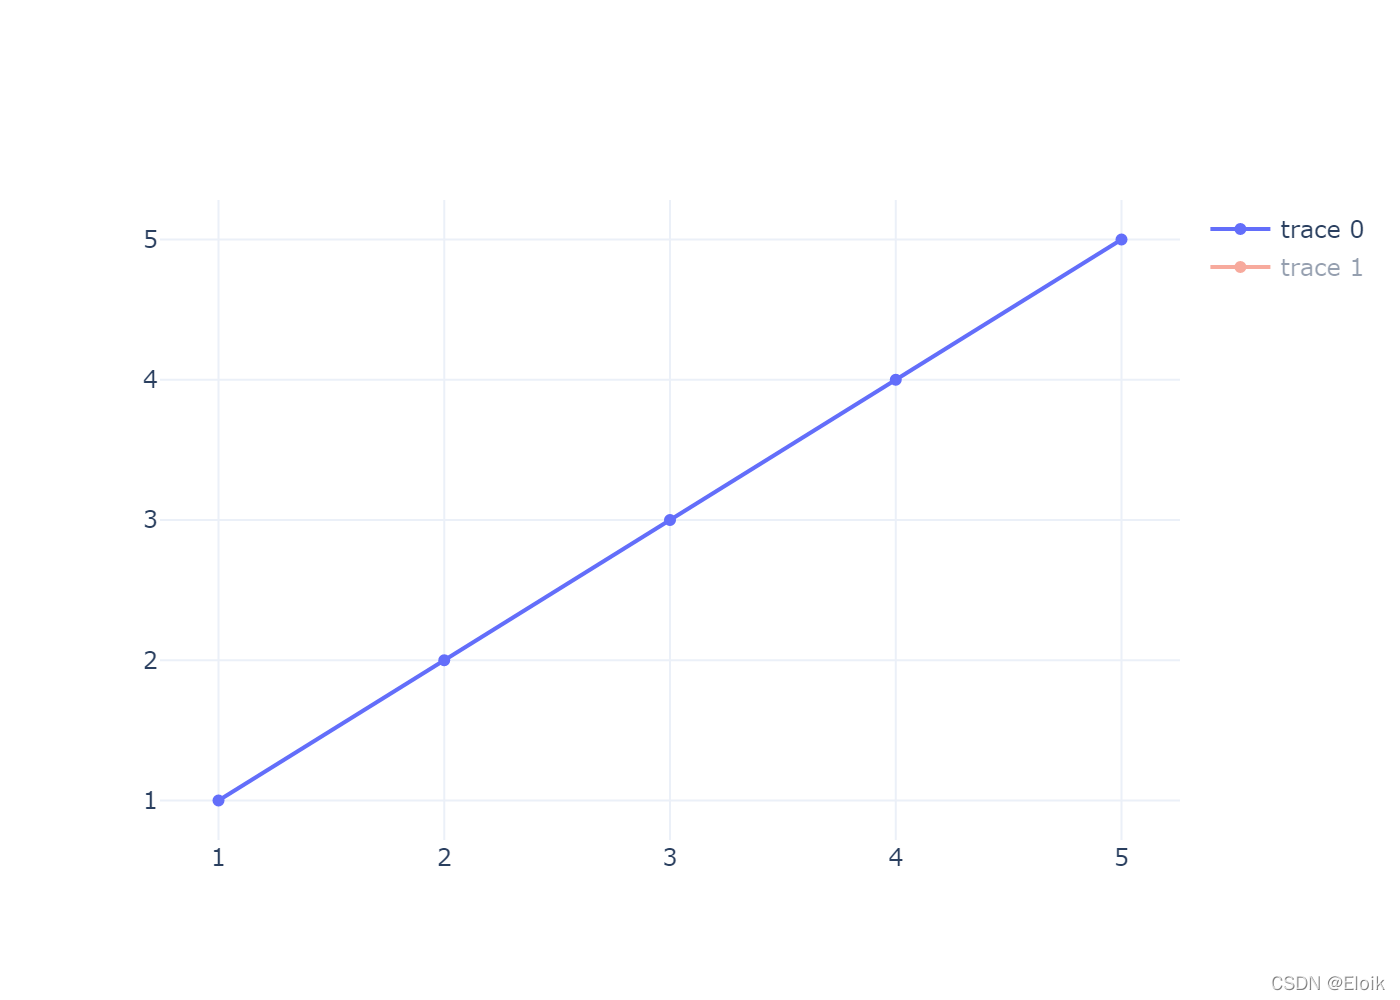
fig = go.Figure()fig.add_trace(go.Scatter(x=[1, 2, 3, 4, 5],y=[1, 2, 3, 4, 5],showlegend=False
))fig.add_trace(go.Scatter(x=[1, 2, 3, 4, 5],y=[5, 4, 3, 2, 1],
))fig.update_layout(showlegend=True)fig.write_image('../pic/legend_7.png', scale=2)
fig.show()
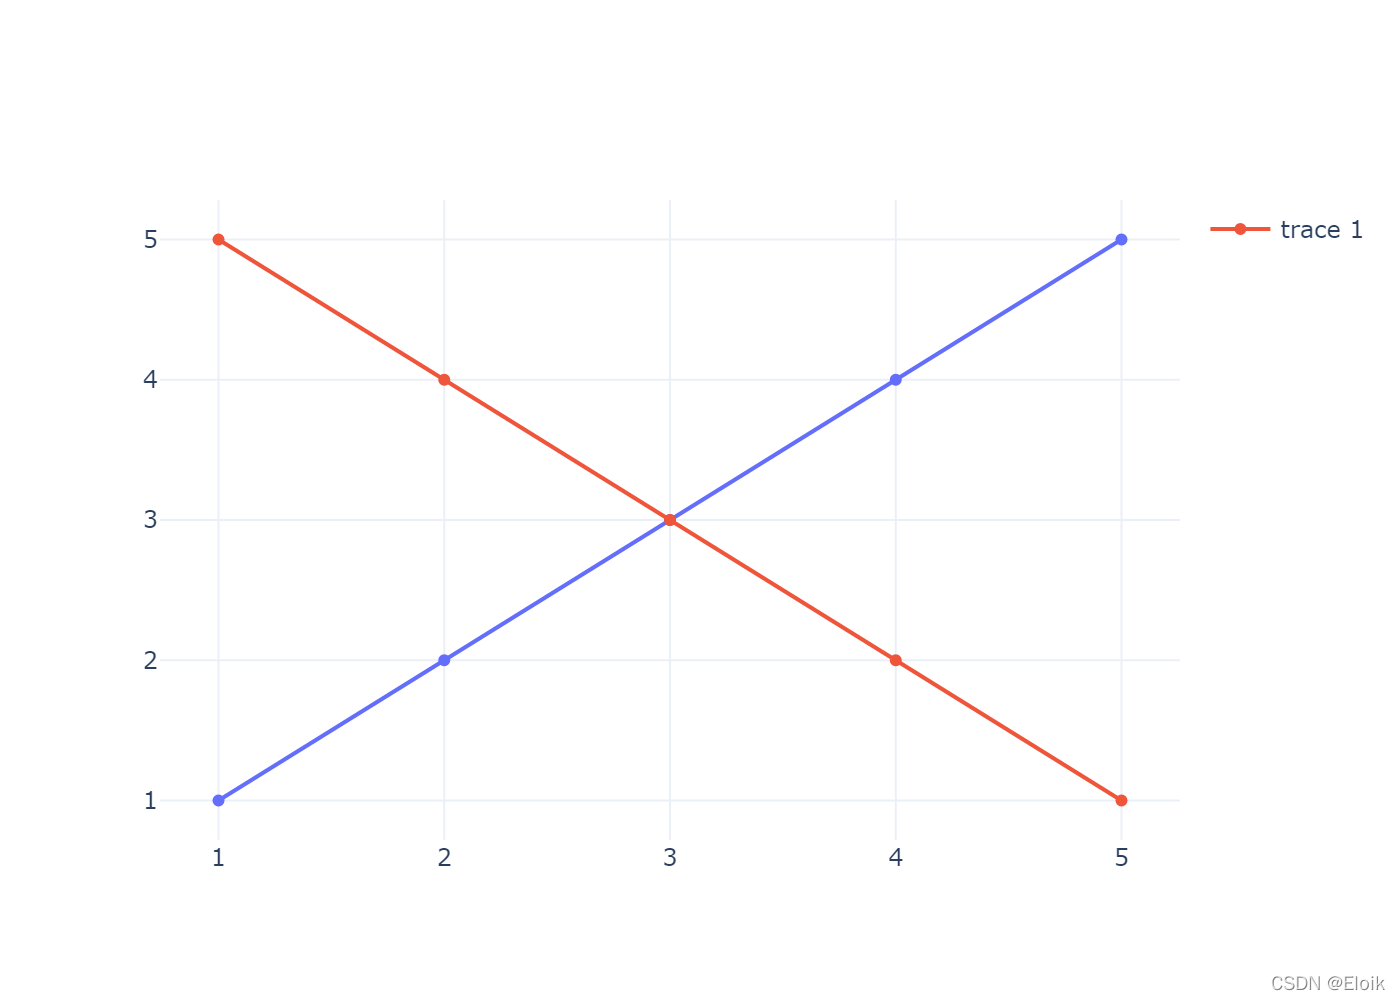
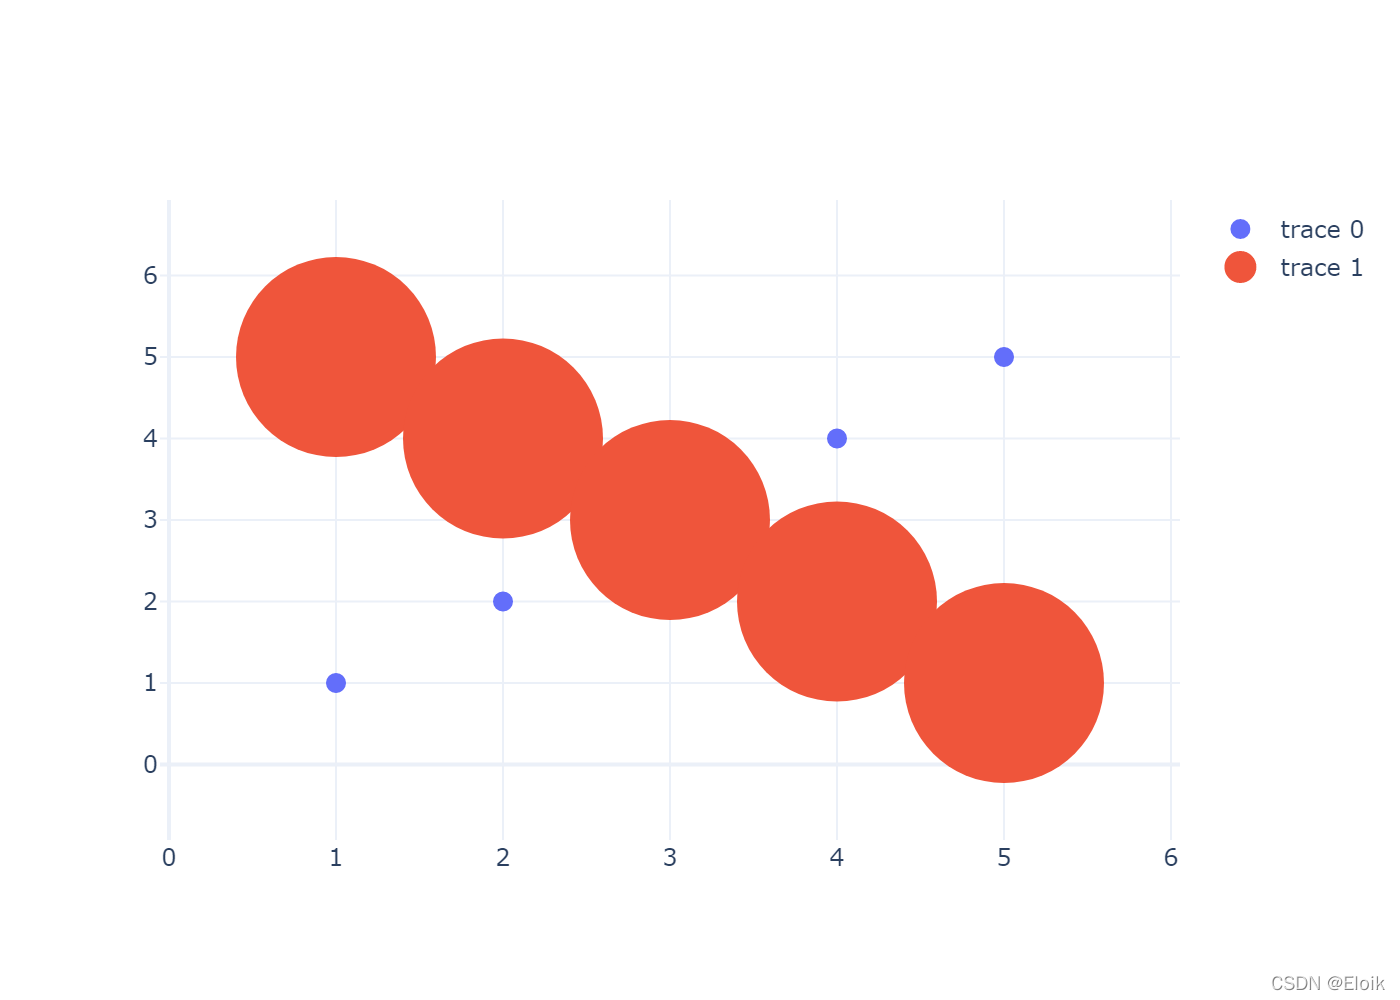
fig = go.Figure()fig.add_trace(go.Scatter(x=[1, 2, 3, 4, 5],y=[1, 2, 3, 4, 5],mode='markers',marker={'size':10}
))fig.add_trace(go.Scatter(x=[1, 2, 3, 4, 5],y=[5, 4, 3, 2, 1],mode='markers',marker={'size':100}
))fig.update_layout(legend= {'itemsizing': 'trace'})fig.write_image('../pic/legend_8.png', scale=2)
fig.show()
本文来自互联网用户投稿,文章观点仅代表作者本人,不代表本站立场,不承担相关法律责任。如若转载,请注明出处。 如若内容造成侵权/违法违规/事实不符,请点击【内容举报】进行投诉反馈!