学习笔记之——基于matlab的数字通信系统(4)
给出sinc信号的波形(离散化)
%%%%一个离散信号,sinc(x)
n=[-20:1:20];
x_actual=abs(sinc(n/2));
figure
stem(n,x_actual);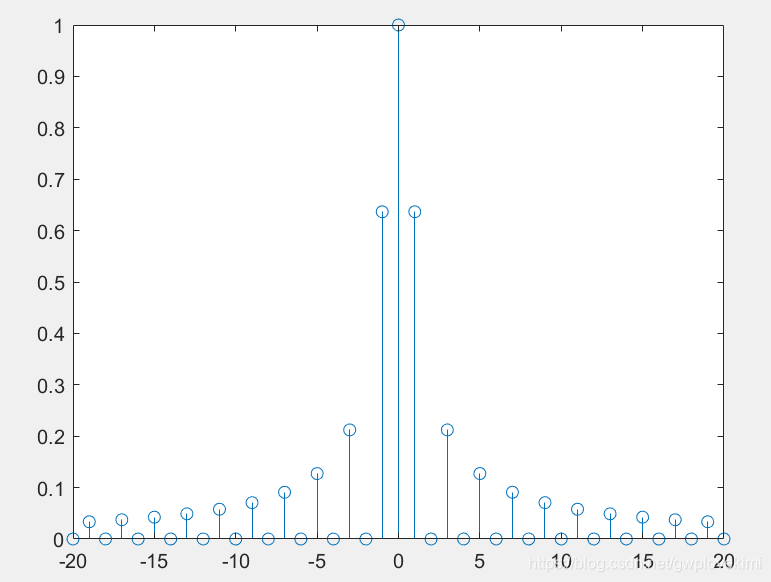
求取一个信号x(t)在a和b区间内的傅里叶级数的系数:
function xx=fseries(funfcn,a,b,n,tol,p1,p2,p3)
%FSERIES    Returns the Fourier series coefficients.
%       XX=FSERIES(FUNFCN,A,B,N,TOL,P1,P2,P3)
%       funfcn=the given function, in an m-file.
%       It can depend on up to three parameters
%       p1,p2, and p3. The function is given
%       over one period extending from 'a' to 'b'
%       xx=vector of length n+1 of Fourier Series
%       Coefficients, xx0,xx1,...,xxn.
%       p1,p2,p3=parameters of funfcn.
%       tol=the error level.j=sqrt(-1);
args0=[];
for nn=1:nargin-5%%%%%%此 MATLAB 函数 针对当前正在执行的函数,返回函数调用中给定函数输入参数的数目。该语法仅可在函数体内使用。args0=[args0,',p',int2str(nn)];
end
args=[args0,')'];
t=b-a;
xx(1)=eval(['1/(',num2str(t),').*quad(funfcn,a,b,tol,[]',args]) for i=1:nnew_fun = 'exp_fnct' ;args=[',', num2str(i), ',', num2str(t), args0, ')' ] ;xx(i+1)=eval(['1/(',num2str(t),').*quad(new_fun,a,b,tol,[],funfcn',args]);
end
接下来调用这个求傅里叶级数系数的函数
% MATLAB script for Illustrative Problem 1.2.
echo on;
fnct='lambda';
a=-4;
b=4;
n=24;
tol=1e-6;%%%%%tol=the error level.
xx=fseries(fnct,a,b,n,tol);%%%调用上面提到的傅里叶级数的函数
xx1=xx(n+1:-1:2);
xx1=[conj(xx1),xx];%%%%%%%conj是求复数的共轭
absxx1=abs(xx1);
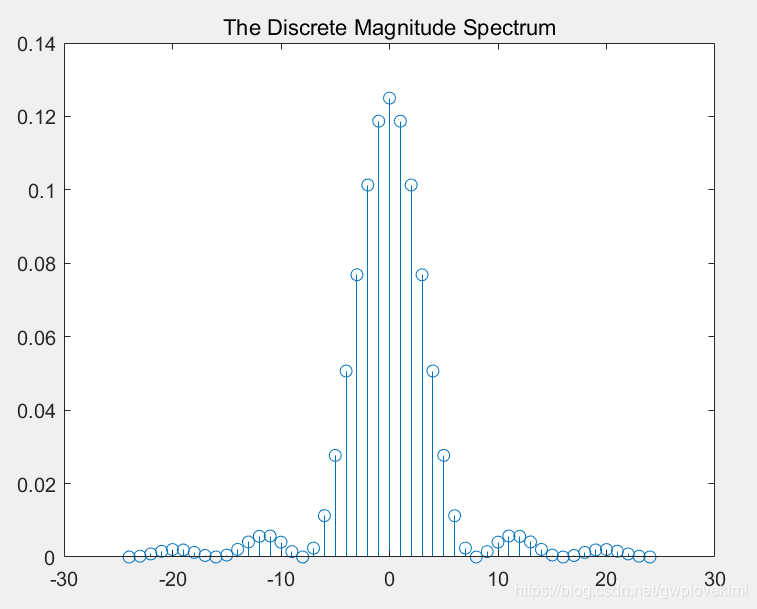
pause % Press any key to see a plot of the magnitude spectrum.
n1=[-n:n];
stem(n1,absxx1)
title('The Discrete Magnitude Spectrum')
phasexx1=angle(xx1);%%%%%%angle()是求相位角
pause % Press any key to see a plot of the phase.
stem(n1,phasexx1)
title('The Discrete Phase Spectrum')按一下按键,即可弹出结果图(离散幅度谱和相位谱)

本文来自互联网用户投稿,文章观点仅代表作者本人,不代表本站立场,不承担相关法律责任。如若转载,请注明出处。 如若内容造成侵权/违法违规/事实不符,请点击【内容举报】进行投诉反馈!