尝试通过MPAndroidChart绘制图表(折线图)
在build.gradle(:app)的dependencies里添加MPAndroidChart
implementation 'com.github.PhilJay:MPAndroidChart:v3.1.0'
在layout布局文件里添加图表控件,折线图LineChart
对布局文件对应的java文件添加修改
public class StatisticsFragment extends android.app.Fragment {private LineChart tempchart;
  //创建一个temchart变量

  //......省略其他代码......
@Overridepublic View onCreateView(LayoutInflater inflater, ViewGroup container,Bundle savedInstanceState) {// Inflate the layout for this fragmentView view=inflater.inflate(R.layout.fragment_statistics, container, false);//画温度折线图tempchart=view.findViewById(R.id.lc_temchange);
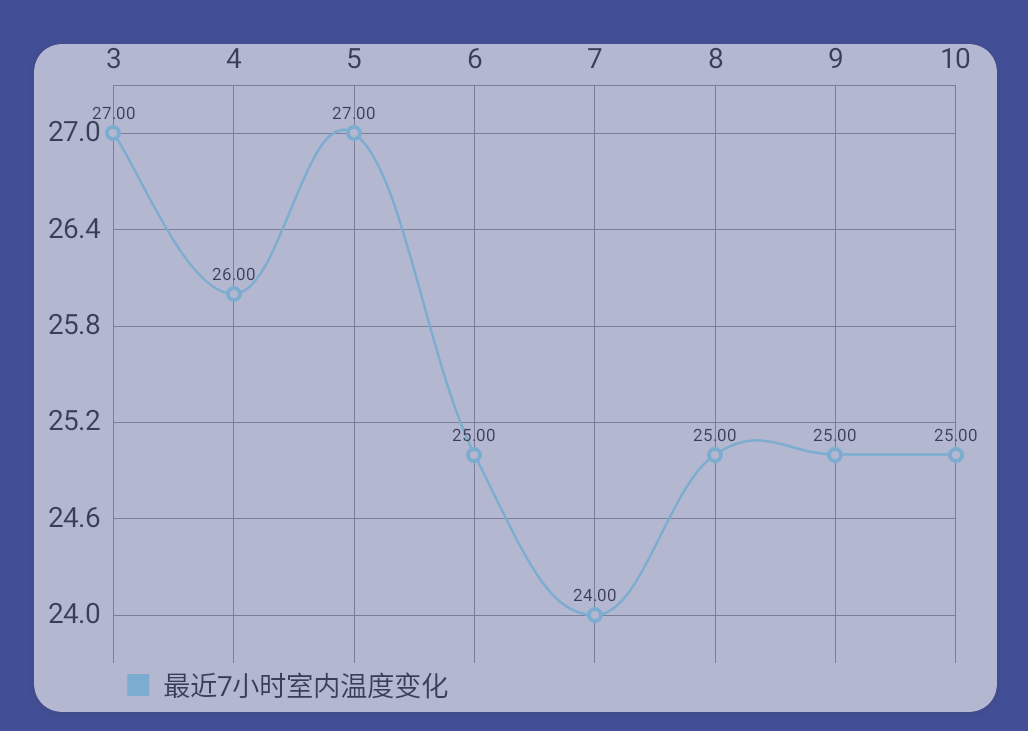
tempchart.getDescription().setEnabled(false);//图表的文本描述,先不管这个设置成false吧tempchart.getAxisRight().setEnabled(false);//禁用右轴ArrayList values1=new ArrayList<>();values1.add(new Entry(3,27));values1.add(new Entry(4,26));values1.add(new Entry(5,27));values1.add(new Entry(6,25));values1.add(new Entry(7,24));values1.add(new Entry(8,25));values1.add(new Entry(9,25));values1.add(new Entry(10,25));LineDataSet set1=new LineDataSet(values1,"最近7小时室内温度变化");set1.setMode(LineDataSet.Mode.CUBIC_BEZIER);//让折线图的曲线平滑LineData data1=new LineData(set1);tempchart.setData(data1);
return view;}
}
效果
以上就可以在android上绘制出一个折线图了,但是大多数情况下坐标轴上需要显示信息,如x轴上显示时间,y轴上显示温度:
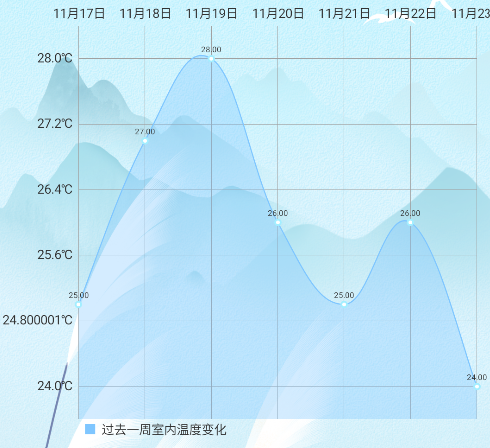
绘制方法:
//绘制温度变化折线图--周private void drawwenduchart_week(){tempchart.clear();tempchart.setScaleEnabled(false);//禁止缩放tempchart.getDescription().setEnabled(false);tempchart.getAxisRight().setEnabled(false);ArrayList values2=new ArrayList<>();values2.add(new Entry(1,25));values2.add(new Entry(2,27));values2.add(new Entry(3,28));values2.add(new Entry(4,26));values2.add(new Entry(5,25));values2.add(new Entry(6,26));values2.add(new Entry(7,24));LineDataSet set2=new LineDataSet(values2,"过去一周室内温度变化");set2.setMode(LineDataSet.Mode.CUBIC_BEZIER);//让折线图的曲线平滑set2.setColor(getActivity().getResources().getColor(R.color.skyblue));//设置折线颜色//设置x轴格式XAxis xAxis=tempchart.getXAxis();xAxis.setValueFormatter(new ValueFormatter() {@Overridepublic String getAxisLabel(float v, AxisBase axisBase) {int x= (int) v;switch (x){case 1:return "11月17日";case 2:return "11月18日";case 3:return "11月19日";case 4:return "11月20日";case 5:return "11月21日";case 6:return "11月22日";case 7:return "11月23日";}return "";}});//设置y轴格式YAxis yAxis=tempchart.getAxisLeft();yAxis.setValueFormatter(new ValueFormatter() {@Overridepublic String getAxisLabel(float v, AxisBase axisBase) {return Float.toString(v)+"℃";}});//设置填充颜色set2.setDrawFilled(true);set2.setFillColor(getActivity().getResources().getColor(R.color.skyblue));LineData data2=new LineData(set2);tempchart.setData(data2);} 本文来自互联网用户投稿,文章观点仅代表作者本人,不代表本站立场,不承担相关法律责任。如若转载,请注明出处。 如若内容造成侵权/违法违规/事实不符,请点击【内容举报】进行投诉反馈!