python实现马丁策略回测3000只股票
python实现马丁策略回测3000只股票
- 批量爬取股票数据
- 批量回测股票
#######################
转载本博客文章时请注明出处
https://blog.csdn.net/weixin_40264579/article/details/112867522
#######################
上一篇文章讲解了如何实现马丁策略,但没有探索其泛化能力,所以这次来尝试回测3000只股票来查看盈利比例。
批量爬取股票数据
这里爬取数据继续使用tushare,根据股票代码来遍历,因为爬取数据需要一定时间,不妨使用多线程来爬取,这里要注意tushare规定每分钟爬取不能超过500次,除非你有很多积分,所以线程数要适当调低。
首先我们生成上证与深证所有股票的代码:
#上证代码
shanghaicode = []
for i in range(600000, 604000, 1):shanghaicode.append(str(i))#深证代码
shenzhencode = []
for i in range(1000000, 1005000, 1):i = str(i)[1:]  shenzhencode.append(i)
然后再定义一个爬取函数,broker则是上一篇文章创建的实例:
def getalldata(code):if os.path.exists(datapath + code + '.csv'):print(code + 'already existed!')returnmetadata = broker.get_stock_pro(code)if len(metadata) == 0:returnmetadata.to_csv('C:/Users/abc/Desktop/' + code + '.csv',index = False)print(code + 'finished!')
导入多线程需要的模块
from concurrent.futures.thread import ThreadPoolExecutor #多线程
遍历所有代码开始爬取,max_workers可适当调整
executor = ThreadPoolExecutor(max_workers=3)for datatemp in executor.map(getalldata, shenzhencode):pass executor = ThreadPoolExecutor(max_workers=3)for datatemp in executor.map(getalldata, shanghaicode):pass
批量回测股票
数据爬好后则可开始回测了,因为回测是CPU瓶颈运算,所以这里就不使用多线程了,速度差不多。
首先将一只股票的回测程序封装到函数中,回测时间设置为2020年全年,起始资金设置为20万元:
def martinmulti(code):broker = backtesting(200000,'20200101', '20201231')#获取股票数据metadata = pd.read_csv(datapath + code)data = np.array(metadata['close'])exdata = np.array(metadata['pre_close'])everyChange = np.array(metadata['change'])date = metadata['trade_date'].valueseveryChange = everyChange/data#开始回测broker.startbackmartin(data, exdata, everyChange, date)dicttemp = {'股票代码': code,'终止现金': broker.cash}return dicttemp
遍历股票代码回测并记录终止现金
cashlist = pd.DataFrame(columns= ['股票代码','终止现金'])
for code in datalist:datatemp = martinmulti(code)cashlist = cashlist.append(datatemp,ignore_index=True)
回测过程如下

接下来看看哪支股票获得了最大利润:

看看平均值
cashlist.mean()
Out[12]:
终止现金    208279.115166
可以从均值看出马丁策略赚作为一种相对保险的方法赚的不多,当然想要找到一劳永逸的方法是不可能的,并且用平均数不能代表一切,那看看盈利比例如何:
plt.rcParams['font.sans-serif'] = ['SimHei']
plt.style.use('ggplot')
plt.title("盈利分布(万元)")
bins = []
for i in range(10000, 600000, 10000):bins.append(i)
plt.hist(cashlist['终止现金'],bins = bins)
plt.axvline(x = cashlist.mean().values,ls="-",c="green")#添加垂直直线
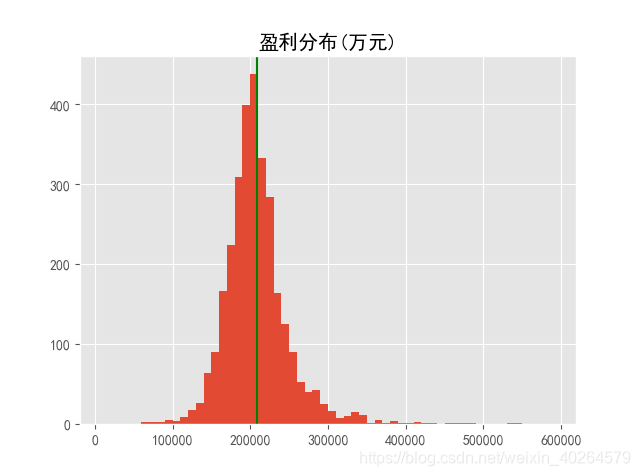
可以看出有折腰的也有翻倍的,且绝大部分集中于20w元旁边,分布图形整体往20万右侧偏移,该策略还有待改进。
完整代码:
# -*- coding: utf-8 -*-
"""
Created on Thu Jan  7 15:43:56 2021@author: HXH
"""
import pandas as pd
import numpy as np
import tushare as ts
import matplotlib.pyplot as plt
import math
from concurrent.futures import ProcessPoolExecutor  #多进程
from concurrent.futures.thread import ThreadPoolExecutor #多线程
import concurrent
import os
from matplotlib import pyplot as plttoken = '这里放你的tushare token'
pro = ts.pro_api()
ts.set_token(token)def generatefile(path):names = []for dirpath, dirnames, filenames in os.walk(path):names = filenamesreturn namesclass backtesting():def __init__(self,startcash, start, end):self.cash = startcash #初始化现金self.hold = 0  #初始化持仓金额self.holdper = self.hold /startcash  #初始化仓位self.log = []  #初始化日志self.cost = 0 #成本价 self.stock_num = 0 #股票数量self.starttime = start #起始时间self.endtime = end #终止时间self.quantlog = [] #交易量记录self.earn = []  #总资产记录self.num_log = []self.riselog = [0]self.droplog = [0]def buy(self, currentprice, count ,date):self.cash -= currentprice*countself.log.append('buy')self.hold += currentprice*countself.holdper = self.hold / (self.cash+ self.hold) self.stock_num += countself.cost = self.hold / self.stock_numself.quantlog.append(count//100)print('买入价:%.2f,手数:%d,现在成本价:%.2f,现在持仓:%.2f,现在筹码:%d 现在日期: %s' %(currentprice ,count//100, self.cost, self.holdper, self.stock_num//100, date))self.earn.append(self.cash+ currentprice*self.stock_num)self.num_log.append(self.stock_num)self.droplog = [0]def sell(self, currentprice, count, date):self.cash += currentprice*countself.stock_num -= countself.log.append('sell')self.hold = self.stock_num*self.costself.holdper = self.hold / (self.cash + self.hold)#self.cost = self.hold / self.stock_numprint('卖出价:%.2f,手数:%d,现在成本价:%.2f,现在持仓:%.2f,现在筹码:%d 现在日期: %s' %(currentprice ,count//100, self.cost, self.holdper, self.stock_num//100, date))self.quantlog.append(count//100)                            self.earn.append(self.cash+ currentprice*self.stock_num)self.num_log.append(self.stock_num)self.droplog = [0]def holdstock(self,currentprice):self.log.append('hold')#print('持有,现在仓位为:%.2f。现在成本:%.2f' %(self.holdper,self.cost))self.quantlog.append(0)self.earn.append(self.cash+ currentprice*self.stock_num)self.num_log.append(self.stock_num)def zzsd(self, currentprice, ex_price):"""激进"""diff = (ex_price - currentprice)/ex_priceself.riselog.append(diff)self.droplog.append(diff)if self.stock_num//100 > 1 or (self.cash/currentprice)//100*100 > 0:if sum(self.riselog) <= -0.07 and (self.cash/currentprice)//100 *100 > 0 :self.buy(currentprice, (self.cash/currentprice)//100 *100)elif sum(self.droplog) > 0.15 and self.stock_num//100 >= 1:self.sell(currentprice,self.stock_num)else: self.holdstock(currentprice)else: self.holdstock(currentprice)if diff < 0:self.droplog = [0]if diff > 0:self.riselog = [0]def martin(self, currentprice, ex_price, everyChange, i, date):"""上升型"""diff = (ex_price - currentprice)/ex_priceself.droplog.append(diff)if sum(self.droplog) <= 0:self.droplog = [0]if self.stock_num//100 > 1 or (self.cash/currentprice)//100*100 > 0 :if sum(self.droplog) >= 0.05:#(self.cost - currentprice)/self.cost <= 0.1: if self.holdper*2 < 0.24:count =(self.cash+self.hold) *(0.24-self.holdper) // currentprice //100 * 100self.buy(currentprice, count, date)elif self.holdper*2 < 1 and (self.hold/currentprice)//100 *100 > 0:self.buy(currentprice, (self.hold/currentprice)//100 *100, date)else: self.sell(currentprice, self.stock_num//100 *100, date);print('及时止损')elif (everyChange[i-1] < 0 and everyChange[i] <0 and self.cost < currentprice) or (everyChange[i] < -0.025 and self.cost < currentprice):                    if (self.stock_num > 0) and ((self.stock_num*(1/2)//100*100) > 0):                        self.sell(currentprice, self.stock_num*(1/2)//100*100 ,date)elif self.stock_num == 100: self.sell(currentprice, 100, date)else: self.holdstock(currentprice)else: self.holdstock(currentprice)else: self.holdstock(currentprice)def get_stock_pro(self, code):if code[0] == '6':code = code + '.SH'else: code = code + '.SZ'print(code)df = pro.daily(ts_code= code, start_date = self.starttime, end_date= self.endtime)df.index=pd.to_datetime(df.date)return dfdef get_stock(self, code):df=ts.get_k_data(code,autype='qfq',start= self.starttime ,end= self.endtime)df.index=pd.to_datetime(df.date)df=df[['open','high','low','close','volume']]return dfdef startbackzzsd(self, data, exdata):"""回测函数"""for i in range(len(data)):if  i < len(data)-1:self.zzsd(data[i],exdata[i])else:if self.stock_num > 0:self.sell(data[i],self.stock_num);print('最后卖出!')else: self.holdstock(data[i]);print('一直持有!')def startbackmartin(self, data ,exdata, everyChange, date):for i in range(len(data)):if  i < len(data)-1:self.martin(data[i],exdata[i], everyChange, i, date[i])else:if self.stock_num > 0:self.sell(data[i],self.stock_num, date[i]);print('最后卖出!')else: self.holdstock(data[i])      def computeCon(log):log = log[::-1]buycount = 0sellcount = 0for action in log:if action == 'buy':buycount += 1elif action == 'sell':breakfor action in log:if action == 'sell':sellcount -= 1elif action == 'buy':break            if sellcount < 0:return sellcountelse: return buycountdatapath = r'C:/Users/abc/Desktop/feng_files/backtest/stockdata/2020/'
datalist = generatefile(datapath)
def martinmulti(code):broker = backtesting(200000,'20200801', '20201227')#获取股票数据metadata = pd.read_csv(datapath + code)data = np.array(metadata['close'][::-1])exdata = np.array(metadata['pre_close'][::-1])everyChange = np.array(metadata['change'][::-1])date = metadata['trade_date'].values[::-1]everyChange = everyChange/data#print(len(data))if len(data) == 0 :print('没有这个股额或者已退市 : %s' %(code))return    #开始回测broker.startbackmartin(data, exdata, everyChange, date)print(code)dicttemp = {'股票代码': code,'终止现金': broker.cash}return dicttemp# #single thread
# executor = ThreadPoolExecutor(max_workers=1)
# for datatemp in executor.map(martinmulti, datalist):
#     cashlist = cashlist.append(datatemp,ignore_index=True)#for loop
cashlist = pd.DataFrame(columns= ['股票代码','终止现金'])
for code in datalist:datatemp = martinmulti(code)cashlist = cashlist.append(datatemp,ignore_index=True)cashlist.to_csv('C:/Users/HXH/Desktop/xize.csv')
cashlist.mean()plt.rcParams['font.sans-serif'] = ['SimHei']
plt.style.use('ggplot')
plt.title("盈利分布(万元)")
bins = []
for i in range(10000, 600000, 10000):bins.append(i)
plt.hist(cashlist['终止现金'],bins = bins)
plt.axvline(x = cashlist.mean().values,ls="-",c="green")#添加垂直直线
本文来自互联网用户投稿,文章观点仅代表作者本人,不代表本站立场,不承担相关法律责任。如若转载,请注明出处。 如若内容造成侵权/违法违规/事实不符,请点击【内容举报】进行投诉反馈!