使用GEE进行岸线自动提取
使用GEE进行岸线自动提取
2023 年 1 月 18 日
在本文中,我将概述一种在 Google Earth Engine 中从卫星图像中提取海岸线的方法。此方法是可扩展的,并自动将海岸线提取为矢量折线。完整的代码链接在帖子末尾可用。
该方法包括以下步骤
- 创建无云合成图像
- 提取所有水体
- 移除内陆水域和小岛屿
- 将栅格转换为矢量
- 简化和提取海岸线
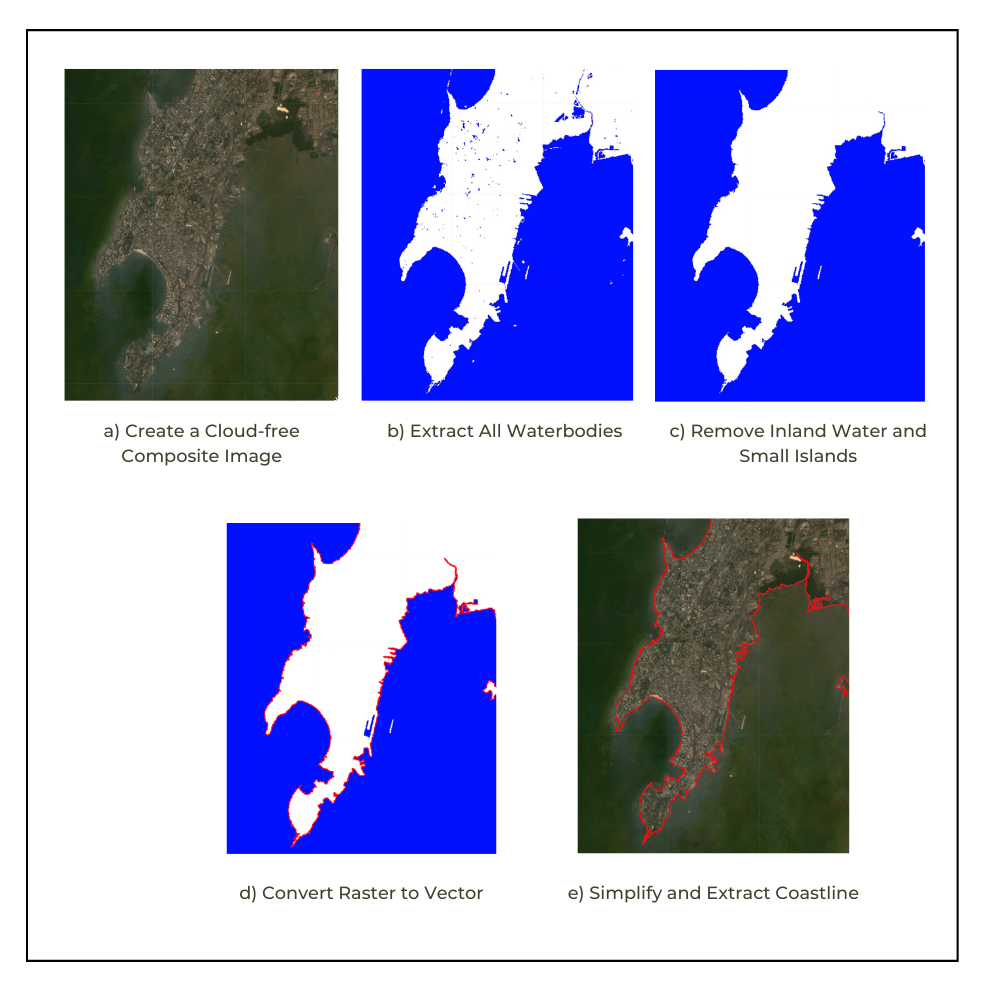
我们将详细介绍每个步骤并查看实现结果所需的 Google Earth Engine API 代码。
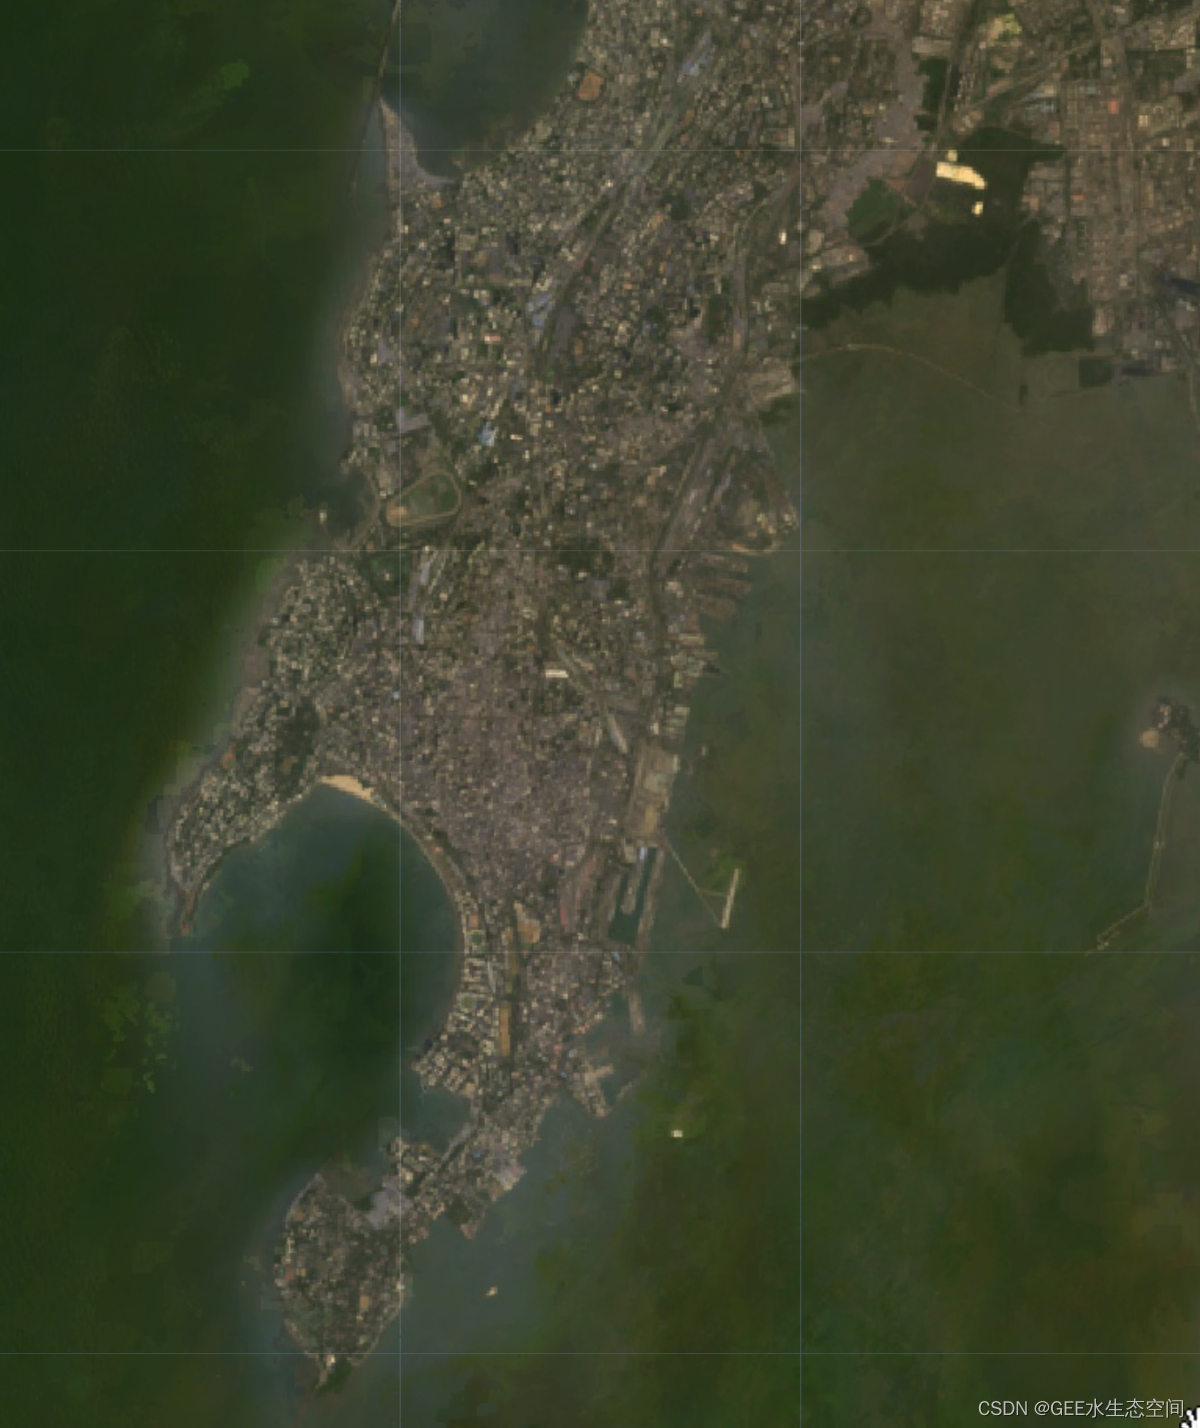
创建无云合成图像
为了能够正确检测海岸线,我们需要无云图像。推荐的方法是创建合成图像。您可以选择合适的日期范围(每月/每年),应用云遮罩去除多云像素,然后创建中值合成以获得无云图像。
提示:多云地区
如果您在一个非常多云的地区工作,中值合成可能仍然有云。在这种情况下,尝试创建一个百分位合成(即 25 个百分位合成),这会给您带来更好的结果。在EEFA Book 的 F4.1 章中了解如何创建百分位数组合。
您可以使用任何多光谱传感器来提取海岸线。至少有一个 NIR 波段,最好是一个 SWIR 波段,以可靠地检测水是有用的。Landsat 和 Sentinel-2 是此任务中使用最广泛的数据集。
在此示例中,我们从 Landsat Level 2(表面反射率)收集开始,过滤选定年份在选定区域收集的图像,应用云遮罩,然后创建中值合成。
// Define parameters var startDate = ee.Date('2020-01-01'); var endDate = startDate.advance(1, 'year'); var collection = ee.ImageCollection('LANDSAT/LC08/C02/T1_L2') .filter(ee.Filter.date(startDate, endDate)) .filter(ee.Filter.bounds(geometry)); // Apply cloud mask var maskL8sr = function(image) { var qaMask = image.select('QA_PIXEL') .bitwiseAnd(parseInt('11111', 2)).eq(0); var saturationMask = image.select('QA_RADSAT').eq(0); // Apply the scaling factors to the appropriate bands. var opticalBands = image.select('SR_B.') .multiply(0.0000275).add(-0.2); var thermalBands = image.select('ST_B.*') .multiply(0.00341802).add(149.0); // Replace the original bands with the scaled ones // and apply the masks. return image.addBands(opticalBands, null, true) .addBands(thermalBands, null, true) .updateMask(qaMask) .updateMask(saturationMask); }; var collection = collection.map(maskL8sr); // Select and Rename Bands var collection = collection.select( ['SR_B2', 'SR_B3', 'SR_B4', 'SR_B5', 'SR_B6', 'SR_B7'], ['blue', 'green', 'red', 'nir', 'swir1', 'swir2'] ); // Create a median composite and clip var composite = collection.median().clip(geometry); var rgbVis = { bands: ['red', 'green', 'blue'], min: 0.0, max: 0.3 }; Map.addLayer(composite, rgbVis, 'Composite Image'); |
警告:处理潮汐高度
一年中所有图像的中值合成将代表所有观察结果的平均海岸线位置——包括涨潮和退潮。这种复合材料不适合比较多年来海岸线的变化。要比较随时间的变化——您必须确保图像处于潮汐的同一阶段。您可以阅读这篇论文,了解一种屏蔽高潮和低潮像素的方法。
另一种方法是使用潮汐估计并过滤在同一潮汐阶段捕获的图像。来源将取决于感兴趣的国家和地区。
– HYCOM surface_elevation数据集可能对推导潮汐信息有用
如果您知道任何其他数据集,请在评论中告诉我。
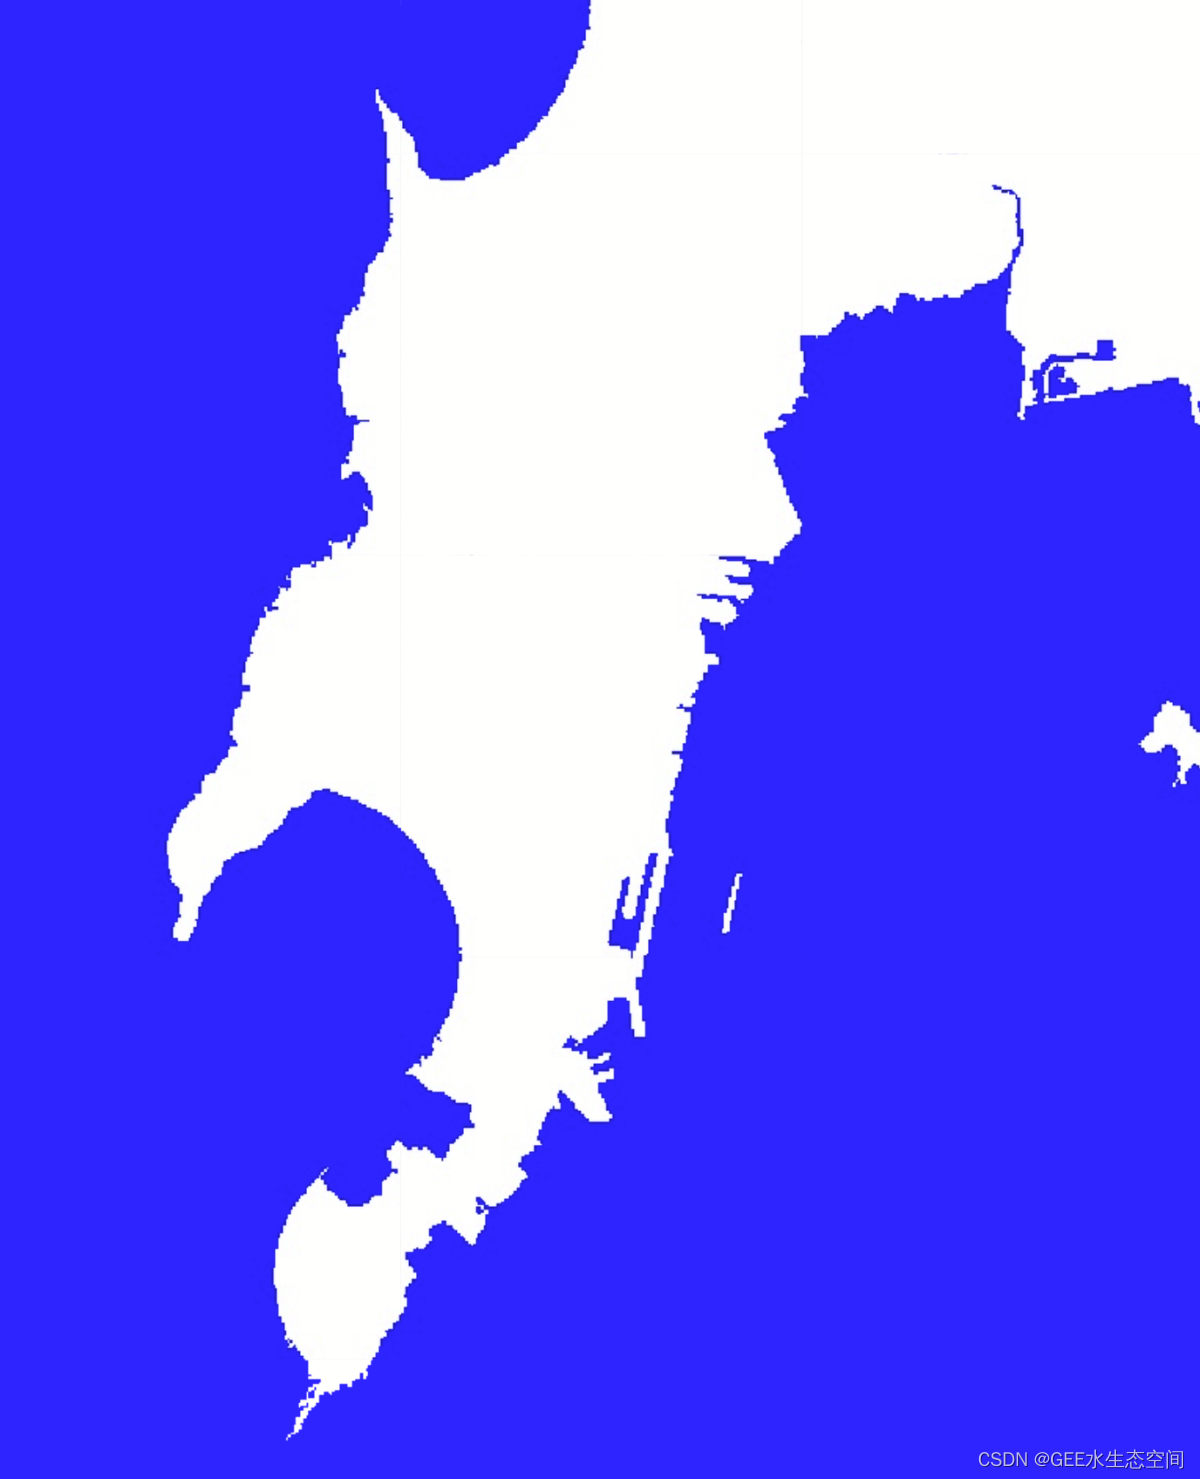
提取所有水体
有几种方法可以从卫星图像中检测和提取地表水。我们想要一种无需手动识别阈值的自动化方法——因此我们将使用 Otsu 动态阈值。在这里,我们计算自动水提取指数 (AWEI) 并使用 Otsu 阈值找到给定图像中水像素的最佳阈值。您也可以尝试使用其他指数,例如 NDWI 或 MNDWI,它们可能在您感兴趣的地区效果更好。如果这种方法没有给出令人满意的结果,我建议你看看无监督聚类方法,它结合了不同的指标,并使用机器学习方法自动识别水像素。
// Code to compute AWEI and detect water // using Otsu thresholding var detectWater = function(image) { var awei = image.expression( '4 * (GREEN - SWIR1) - (0.25 * NIR + 2.75 * SWIR2)', { 'GREEN': image.select('green'), 'NIR': image.select('nir'), 'SWIR1': image.select('swir1'), 'SWIR2': image.select('swir2'), }).rename('awei'); // Otsu Thresholding var thresholding = require( 'users/gena/packages:thresholding'); var scale = 100; var bounds = geometry; var cannyThreshold = 0.7; var cannySigma = 1; var minValue = -0.2; var th = thresholding.computeThresholdUsingOtsu( awei, scale, bounds, cannyThreshold, cannySigma, minValue); // Create a Land-Water Image using Otsu Threshold // You can replace th with a manual threshold if // Otsu results are not satisfactory var water = awei.gt(th).rename('water'); return water; }; var water = detectWater(composite); var waterVis = {min:0, max:1, palette: ['white', 'blue']}; Map.addLayer(water, waterVis, 'All Water'); |

移除内陆水域和小岛屿
我们的主要兴趣是陆水边界,因此我们移除了所有内陆水体和海洋中的小岛。这是通过删除所有小于所选尺寸的水像素簇来完成的。
// Export resolution in meters is at which the coastline will // be vectorized. // Higher resolution (such as 10) will give smooother results var exportResolutionMeters = 30; // We need a threshold in meters to remove inland waterbodies // and coastal islands. If you have a large waterbody close // to the coastline, set this higher. var waterbodySizeMeters = 2000; var islandSizeMeters = 1000; // This function takes a binary Land-Water image and // removes inland water and small islands function removeInlandWaterAndIslands(waterImage) { // reduceConnectedComponents expects an interger image waterImage = waterImage.int(); // Define neighborhood based on user parameters var connectedPixelsLand = ee.Number(waterbodySizeMeters) .divide(exportResolutionMeters).int(); var connectedPixelsWater = ee.Number(islandSizeMeters) .divide(exportResolutionMeters).int(); // Remove inland water var landFilled = waterImage.addBands(waterImage) .reduceConnectedComponents( ee.Reducer.median(), 'water', connectedPixelsLand) .unmask(99).eq(99).and(waterImage.neq(0)); // Remove small islands var waterFilled = landFilled.addBands(landFilled) .reduceConnectedComponents( ee.Reducer.median(), 'water_1', connectedPixelsWater) .unmask(99).eq(99).and(landFilled.neq(1)); // Land-Water Boundary return waterFilled; } var landWaterBoundary = removeInlandWaterAndIslands(water); var landWaterBoundaryVis = { min:0, max:1, palette: ['blue', 'white'] }; Map.addLayer(landWaterBoundary, landWaterBoundaryVis, 'Land-Water Boundary (Raster)'); |
将栅格转换为矢量
接下来,我们将二值水陆图像矢量化以获得陆地区域的多边形轮廓。这也可以作为许多类型分析的最终输出。因此,您可以将其导出为 shapefile 并进一步使用。
// Convert the coastline image to vector var vectors = ee.Image(landWaterBoundary).selfMask() .reduceToVectors({ geometry: geometry, scale: exportResolutionMeters, eightConnected: true, maxPixels: 1e10, tileScale: 16 }); Map.addLayer(vectors, {color: 'blue'}, 'Land-Water Boundary (Vector)'); |
简化和提取海岸线
许多应用程序需要生成的几何图形为线而不是多边形。因此,我们采用生成的多边形,对其进行简化并提取坐标。然后我们使用坐标来构造ee.Geometry.MultiLineString()特征。
| 1个 2个 3个 4个 5个 6个 7 8个 9 10 11 12 13 14 15 16 17 18 19 20 21 22 23 24 25 | // This function takes vectorized polygons and // extracts a polyline var simplifyAndExtractCoastline = function(vectors){ // Simplify vectors var processedVectors = vectors.map(function(f) { var coords = f.geometry() .simplify({maxError: exportResolutionMeters}) .coordinates(); // Buffer the geometry by a pixel to avoid rasterizing // the boundary polygon var bufferDistance = ee.Number( exportResolutionMeters).multiply(-1); return f .setGeometry( ee.Geometry.MultiLineString(coords) .intersection(geometry.buffer(bufferDistance))); }); return processedVectors; }; var coastlineVector = simplifyAndExtractCoastline( vectors); Map.addLayer(coastlineVector, {color: 'red'}, 'Coastline (Vector)'); |

导出结果
GEE 的代码编辑器环境仅限运行 5 分钟的交互式计算。如果您尝试从一个大区域中提取海岸线,您可能会遇到图块或内存错误。这仅仅意味着您无法以交互方式可视化结果。要在这种情况下获得结果,您必须导出结果。导出可以运行更长时间并且可以访问更大的资源池。您可以将结果导出到 Google 云端硬盘,甚至可以导出到您自己的资产存储中。
// Exports // Exports can run for longer time and have more resources // If any of your layers time-out or give tile errors, // Run the exports instead Export.table.toDrive({ collection: coastlineVector, description: 'Extracted_Coastline_Vector', folder: 'earthengine', fileNamePrefix: 'coastline', fileFormat: 'SHP'}) Export.image.toDrive({ image: landWaterBoundary, description: 'Extracted_Land_Water_boundary_Raster', folder: 'earthengine', fileNamePrefix: 'land_water_boundary_raster', region: geometry, scale: exportResolutionMeters, maxPixels: 1e10}) Export.image.toDrive({ image: composite, description: 'Composite', folder: 'earthengine', fileNamePrefix: 'composite', region: geometry, scale: exportResolutionMeters, maxPixels: 1e10}) |
这是从 Landsat 图像中自动提取海岸线的完整脚本。您可以针对不同的传感器或不同的方法使用和调整代码。
The complete script is linked at the bottom. https://code.earthengine.google.co.in/08ac8b9630010644ac4783f0f0645b0a
一旦能够检测到水,提取海岸线的过程就相同了。使用 SAR 检测水比使用光学图像容易得多。这是一个使用静态阈值提取水的入门脚本。您可以轻松地使用我在本文中使用的 Otsu-thresholding 而不是静态阈值。
https://code.earthengine.google.co.in/7507e30acc01095f8fac34d989aefa90
有不同 Landsat 卫星的 GEE 集合。您需要将 Landsat 8 集合替换为来自另一颗卫星的适当集合。您还需要更改适合卫星的云遮罩功能。
这是 Landsat 5 的示例。https ://code.earthengine.google.co.in/aa3ae8052feb2335300a9b29f26b6e96
本文来自互联网用户投稿,文章观点仅代表作者本人,不代表本站立场,不承担相关法律责任。如若转载,请注明出处。 如若内容造成侵权/违法违规/事实不符,请点击【内容举报】进行投诉反馈!