from matplotlib import pyplot as plt
from matplotlib import font_manager# 数据
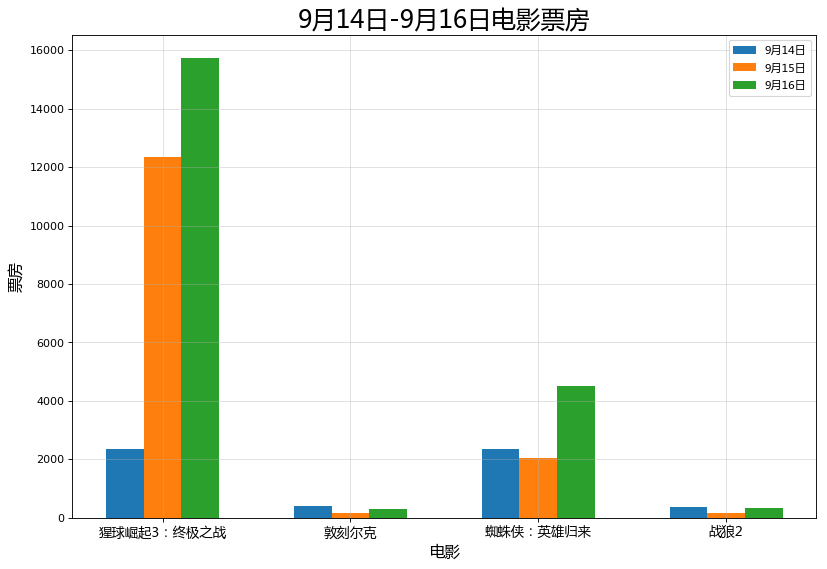
a = ["猩球崛起3:终极之战", "敦刻尔克", "蜘蛛侠:英雄归来", "战狼2"]
b_14 = [2358, 399, 2358, 362]
b_15 = [12357, 156, 2045, 168]
b_16 = [15746, 312, 4497, 319]# 设置图形大小
plt.figure(figsize=(12, 8), dpi=80)# 设置中文显示
my_font = font_manager.FontProperties("Microsoft YaHei")# 设置条形宽度
width = 0.2# 多个条形的x轴位置
x_14 = [i for i in range(len(a))]
x_15 = [i + width for i in range(len(a))]
x_16 = [i + width * 2 for i in range(len(a))]# 设置刻度
plt.xticks(x_15, a, fontproperties=my_font, fontsize=12)# 添加描述信息
plt.xlabel("电影", fontproperties=my_font, fontsize=14)
plt.ylabel("票房", fontproperties=my_font, fontsize=14)
plt.title("9月14日-9月16日电影票房", fontproperties=my_font, fontsize=22)# 添加网格
plt.grid(alpha=0.4)# 绘制
plt.bar(x_14, b_14, width=width, label="9月14日")
plt.bar(x_15, b_15, width=width, label="9月15日")
plt.bar(x_16, b_16, width=width, label="9月16日")# 添加图例
plt.legend(prop=my_font)# 保存图形
plt.savefig("./绘制多条条形图.png")# 展示
plt.show()
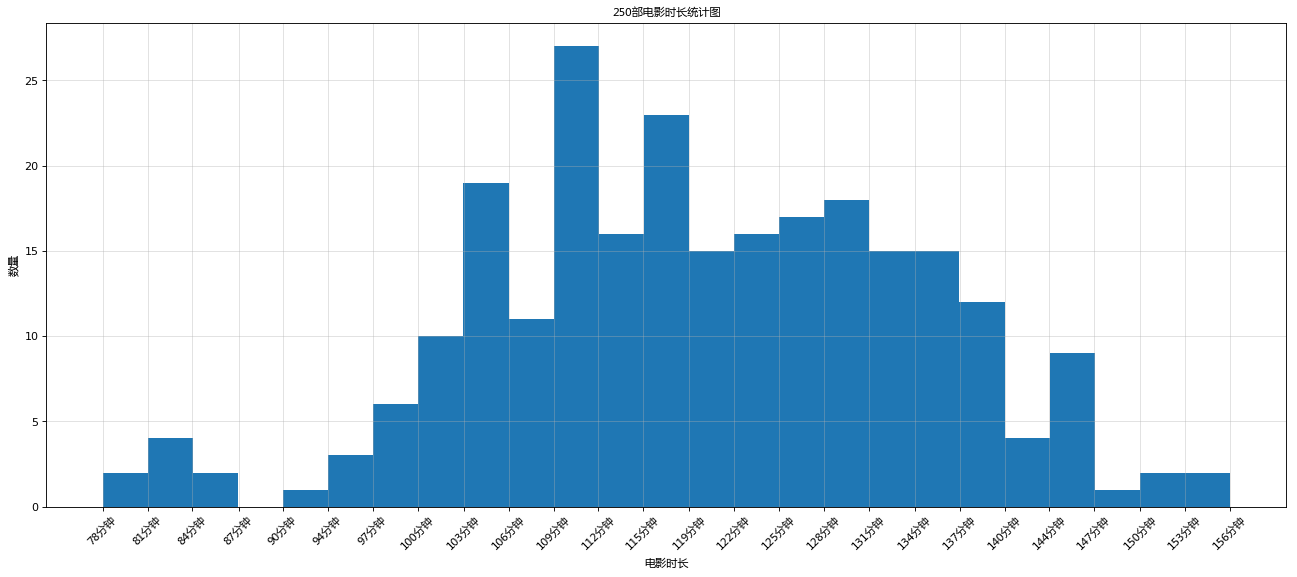
# 统计出250部电影时长的分布状态
from matplotlib import pyplot as plt
from matplotlib import font_manager
# 数据
a = [131, 98, 125, 131, 124, 139, 131, 117, 128, 108, 135, 138, 131, 102, 107, 114, 119, 128, 121, 142, 127, 130, 124,101, 110, 116, 117, 110, 128, 128, 115, 99, 136, 126, 134, 95, 138, 117, 111, 78, 132, 124, 113, 150, 110, 117, 86,95, 144, 105, 126, 130, 126, 130, 126, 116, 123, 106, 112, 138, 123, 86, 101, 99, 136, 123, 117, 119, 105, 137,123, 128, 125, 104, 109, 134, 125, 127, 105, 120, 107, 129, 116, 108, 132, 103, 136, 118, 102, 120, 114, 105, 115,132, 145, 119, 121, 112, 139, 125, 138, 109, 132, 134, 156, 106, 117, 127, 144, 139, 139, 119, 140, 83, 110, 102,123, 107, 143, 115, 136, 118, 139, 123, 112, 118, 125, 109, 119, 133, 112, 114, 122, 109, 106, 123, 116, 131, 127,115, 118, 112, 135, 115, 146, 137, 116, 103, 144, 83, 123, 111, 110, 111, 100, 154, 136, 100, 118, 119, 133, 134,106, 129, 126, 110, 111, 109, 141, 120, 117, 106, 149, 122, 122, 110, 118, 127, 121, 114, 125, 126, 114, 140, 103,130, 141, 117, 106, 114, 121, 114, 133, 137, 92, 121, 112, 146, 97, 137, 105, 98, 117, 112, 81, 97, 139, 113, 134,106, 144, 110, 137, 137, 111, 104, 117, 100, 111, 101, 110, 105, 129, 137, 112, 120, 113, 133, 112, 83, 94, 146,133, 101, 131, 116, 111, 84, 137, 115, 122, 106, 144, 109, 123, 116, 111, 111, 133, 150]# 设置中文显示
my_font = font_manager.FontProperties("Microsoft YaHei")# 设置图形大小
plt.figure(figsize=(20, 8), dpi=80)# 设置组数
bins = 25# 设置x轴分组后的刻度
_x = [round(min(a) + i * (max(a)-min(a))/bins, 1) for i in range(bins+1)]
_x_labels = ["{}分钟".format(round(min(a) + i * (max(a)-min(a))/bins)) for i in range(bins+1)]
plt.xticks(_x, _x_labels, fontproperties=my_font, rotation=45)# 添加网格
plt.grid(alpha=0.4)# 绘制,有2个参数,数据和组数
plt.hist(a, bins=bins)#频率分布直方图: normed=True
#plt.hist(a, bins=bins, normed=True)# 添加描述信息
plt.xlabel("电影时长", fontproperties=my_font)
plt.ylabel("数量", fontproperties=my_font)
plt.title("250部电影时长频数分布直方图", fontproperties=my_font)# 展示
plt.show()
本文来自互联网用户投稿,文章观点仅代表作者本人,不代表本站立场,不承担相关法律责任。如若转载,请注明出处。 如若内容造成侵权/违法违规/事实不符,请点击【内容举报】进行投诉反馈!
