《ELKStack——日志分析管理》
目录
- 一. ELKStack简介
- 1. Elasticsearch
- 2. Logstash
- 3. Kibana
- 二. ELK部署环境准备
- 三. Elasticsearch部署
- 1. 安装JDK
- 2. 安装Elasticsearch
- 实战1:监控elasticsearch集群状态
- 实战2:安装elasticsearch插件head
- 1)安装
- 2)浏览器访问9100端口,将连接地址修改为elasticsearch地址。
- 3)测试提交数据
- 4)验证索引是否存在
- 5)查看数据
- 6)Master和Slave的区别:
- 四. Logstash部署
- 1、安装logstash
- 2、测试logstash是否正常
- 3. 启动logstash
- 4. elasticsearch服务器验证收到数据
- 五. kibana部署
- 1、安装kibana
- 2、启动kibana并验证
- 3、查看状态
- 五、通过logstash收集系统message日志
- 1)配置logstash配置文件
- 2)检测配置文件语法是否有错误
- 3)修改日志文件的权限并重启logstash
- 4)elasticsearch界面查看并查询
- 5)kibana界面创建索引并查看
- 六、ELK快速入门二-通过logstash收集日志
- 收集多个日志文件
- 1)logstash配置文件编写
- 2)给日志文件赋予可读权限并重启logstash
- 3)向被收集的文件中写入数据;是为了马上能在elasticsearch的web界面和klbana的web界面里面查看到数据。
- 4)在kibana界面添加system-log索引模式
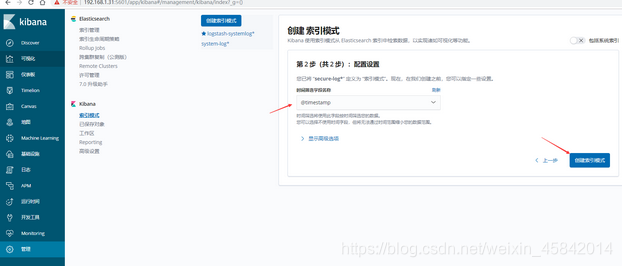
- 5)在kibana界面添加secure-log索引模式
- 6)kibana查看日志
一. ELKStack简介
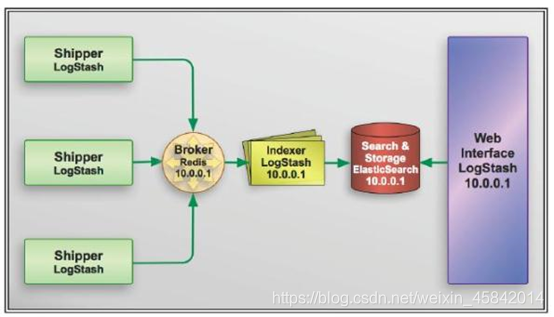
ELKStack简介 – 日志分析管理(都是Java架构 – 需要JDK底层)
什么是ELK?
通俗来讲,ELK是由Elasticsearch、Logstash、Kibana 三个开源软件组成的一个组合体,这三个软件当中,每个软件用于完成不同的功能,ELK又称ELKstack,官网 https://www.elastic.co/ , ELK主要优点有如下几个:
-
处理方式灵活:elasticsearch是实时全文索引,具有强大的搜索功能(搜索引擎 --> 百度–> lucence引擎功能)
-
配置相对简单:elasticsearch全部使用JSON接口,logstash使用模块配置(和Jenkins + Ansible --> 模块+插件),kibana的配置文件部分更简单
-
检索性能高:基于优秀的设计,虽然每次查询都是实时,但是也可以达到百亿级数据的查询秒级响应
-
集群线性扩展:elasticsearch和logstash都可以灵活线性扩展 – > ES本身没有单点概念 – 集群概念 – ES至少两个 – 没有主从概念 - 从谁身上都能看到所有的数据
-
前端操作绚丽:kibana的前端设计比较绚丽,而且操作简单
1. Elasticsearch
elasticsearch是一个高度可扩展全文搜索和分析引擎,基于Apache Lucene 构建,能对大容量的数据进行接近实时的存储、搜索和分析操作,可以处理大规模日志数据,比如Nginx、Tomcat、系统日志等功能。
2. Logstash
数据收集引擎。它支持动态的从各种数据源搜集数据,并对数据进行过滤、分析、丰富、统一格式等操作,然后存储到用户指定的位置;支持普通log、自定义json格式的日志解析。
3. Kibana
数据分析和可视化平台。通常与 Elasticsearch 配合使用,对其中数据进行搜索、分析和以统计图表的方式展示。
二. ELK部署环境准备
这里实验所使用系统CentOS 7.5.1804 x86_64,服务器信息如下。并关闭防火墙和selinux,及host绑定等。
| IPAddr | HostName | Mem |
|---|---|---|
| 192.168.194.130 | node1 | 2G |
| 192.168.194.131 | node2 | 2G |
epel源配置
[root@localhost ~]# wget -O /etc/yum.repos.d/epel.repo http://mirrors.aliyun.com/repo/epel-7.repo
关闭防火墙
[root@localhost ~]# systemctl stop firewalld
[root@localhost ~]# setenforce 0
三. Elasticsearch部署
因为elasticsearch服务运行需要java环境,因此两台elasticsearch服务器需要安装java环境。
1. 安装JDK
jdk包
链接: https://pan.baidu.com/s/1YXeyNrqLHAQuj7LVQwxepQ 提取码: njmf 复制这段内容后打开百度网盘手机App,操作更方便哦
两个节点都要安装
[root@localhost ~]# rpm -ivh jdk-8u131-linux-x64_.rpm
2. 安装Elasticsearch
两台节点都需要安装elasticsearch,使用yum安装会很慢,所以先下载下来传到服务器进行安装,官网下载地址:https://www.elastic.co/cn/downloads/past-releases#elasticsearch
elasticsearch包
链接: https://pan.baidu.com/s/15_W_Kqfu0Gvk14bFunXNGg 提取码: 4a99 复制这段内容后打开百度网盘手机App,操作更方便哦
配置elasticsearch,elk2配置一个相同的节点,通过组播进行通信,如果无法通过组播查询,修改成单播即可。
将下载的elasticsearch包上传到服务器进行安装。
安装elasticsearch
[root@localhost ~]# rpm -ivh elasticsearch-6.6.2.rpm
修改配置文件
本机在集群内的节点(node1/node2)名称不一样,其他都一样
[root@localhost ~]# cd /etc/elasticsearch/
[root@localhost elasticsearch]# cp elasticsearch.yml elasticsearch.yml.bak -----备份文件
[root@localhost elasticsearch]# vim elasticsearch.yml
[root@localhost elasticsearch]# cat elasticsearch.yml|egrep -v "^#|^$"
cluster.name: my_1803a #ELK的集群名称,名称相同即属于是同一个集群
node.name: node-1 #本机在集群内的节点名称
path.data: /var/lib/elasticsearch #数据存放目录
path.logs: /var/log/elasticsearch #日志保存目录
#bootstrap.memory_lock: true    #服务启动的时候锁定足够的内存,防止数据写入swap
network.host: 192.168.194.130 #监听的IP地址
http.port: 9200 #服务监听的端口
discovery.zen.ping.unicast.hosts: ["192.168.194.130", "192.168.194.131"] #单播配置一台即可
修改内存限制,内存锁定需要进行配置需要2g以上内存,否则会导致无法启动elasticsearch。
[root@localhost ~]# vim /usr/lib/systemd/system/elasticsearch.service
[root@localhost ~]# cat /usr/lib/systemd/system/elasticsearch.service |sed -n 7,8p
[Service]
LimitMEMLOCK=infinity #无限制使用内存
[root@localhost ~]# systemctl daemon-reload
[root@localhost ~]# vim /etc/elasticsearch/jvm.options
[root@localhost ~]# cat /etc/elasticsearch/jvm.options |grep "^-Xm"
-Xms2g #最小和最大内存限制
-Xmx2g
最小和最大内存限制,为什么最小和最大设置一样大?参考:
https://www.elastic.co/guide/en/elasticsearch/reference/current/heap-size.html
[root@localhost ~]# systemctl start elasticsearch -----启动服务
[root@localhost ~]# netstat -lptnu|grep java -----查看端口状态
tcp6       0      0 192.168.194.130:9200    :::*                    LISTEN      3616/java
tcp6       0      0 192.168.194.130:9300    :::*                    LISTEN      3616/java
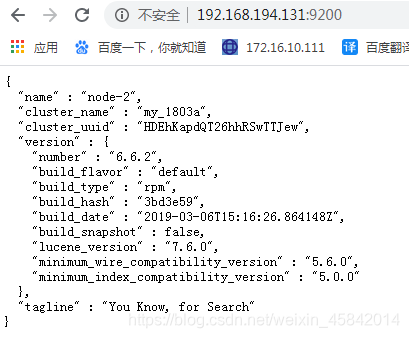
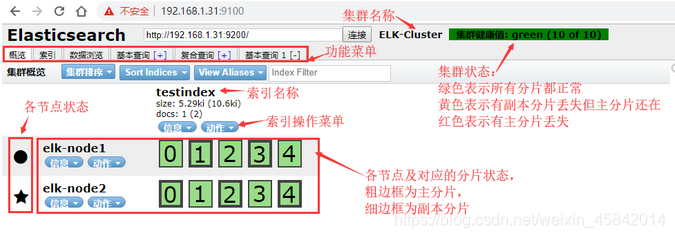
通过浏览器访问elasticsearch端口

实战1:监控elasticsearch集群状态
通过shell命令获取集群状态,这里获取到的是一个json格式的返回值,例如对status进行分析,如果等于green(绿色)就是运行在=正常,等于yellow(黄色)表示副本分片丢失,red(红色)表示主分片丢失。
[root@localhost ~]# curl http://192.168.194.130:9200/_cluster/health?pretty=true
{"cluster_name" : "my_1803a","status" : "green","timed_out" : false,"number_of_nodes" : 2,"number_of_data_nodes" : 2,"active_primary_shards" : 0,"active_shards" : 0,"relocating_shards" : 0,"initializing_shards" : 0,"unassigned_shards" : 0,"delayed_unassigned_shards" : 0,"number_of_pending_tasks" : 0,"number_of_in_flight_fetch" : 0,"task_max_waiting_in_queue_millis" : 0,"active_shards_percent_as_number" : 100.0
}
[root@localhost ~]# curl http://192.168.194.131:9200/_cluster/health?pretty=true
{"cluster_name" : "my_1803a","status" : "green","timed_out" : false,"number_of_nodes" : 2,"number_of_data_nodes" : 2,"active_primary_shards" : 0,"active_shards" : 0,"relocating_shards" : 0,"initializing_shards" : 0,"unassigned_shards" : 0,"delayed_unassigned_shards" : 0,"number_of_pending_tasks" : 0,"number_of_in_flight_fetch" : 0,"task_max_waiting_in_queue_millis" : 0,"active_shards_percent_as_number" : 100.0
}实战2:安装elasticsearch插件head
我们不可能经常通过命令来查看集群的信息,所以就使用到了插件 –head。插件是为了完成不同的功能,官方提供了一些插件但大部分是收费的,另外也有一些开发爱好者提供的插件,可以实现对elasticsearch集群的状态监控与管理配置等功能。
head:主要用来做集群管理的插件
下载地址:https://github.com/mobz/elasticsearch-head
1)安装
安装npm和git
[root@localhost ~]# yum -y install npm git
显示没有npm命令执行
[root@localhost ~]# yum -y install epel-release
[root@localhost ~]# yum -y install npm
[root@localhost ~]# npm -v
3.10.10
安装elasticsearch-head插件
[root@localhost ~]# cd /usr/local/src/
[root@localhost src]# git clone git://github.com/mobz/elasticsearch-head.git
[root@localhost src]# cd elasticsearch-head/
[root@localhost elasticsearch-head]# npm install grunt -save --registry=https://registry.npm.taobao.org
- npm(Node Package Manager)意思是 node 的包管理器,它是随着 NodeJs 安装时一起被安装的;
- 无论是在前端还是在前端开发中都会使用到 npm 包管理器。
- grunt是一套前端自动化工具,一个基于nodeJs的命令行工具,一般用于:
- 压缩文件
- 合并文件
- 简单语法检查
[root@localhost elasticsearch-head]# ll node_modules/grunt #确定该目录有生成文件
总用量 20
drwxr-xr-x. 2 root root   19 4月   6 2016 bin
-rw-r--r--. 1 root root 7111 4月   6 2016 CHANGELOG
drwxr-xr-x. 4 root root   47 10月 20 18:48 lib
-rw-r--r--. 1 root root 1592 3月  23 2016 LICENSE
drwxr-xr-x. 5 root root   50 10月 20 18:48 node_modules
-rw-r--r--. 1 root root 3893 10月 20 18:48 package.json
-rw-r--r--. 1 root root  878 2月  12 2016 README.md
[root@localhost elasticsearch-head]# npm install --registry=https://registry.npm.taobao.or   #执行安装
[root@elk1 elasticsearch-head]# npm run start &    #后台启动服务
[root@elk1 ~]# ss -nlt |grep 9100
LISTEN     0      128          *:9100                     *:*
修改elasticsearch服务配置文件,开启跨域访问支持(跨域是指跨域名的访问),然后重启elasticsearch服务
[root@localhost ~]# vim /etc/elasticsearch/elasticsearch.yml
http.cors.enabled: true     #最下方添加
http.cors.allow-origin: "*"
为了方便管理elasticsearch-head插件,编写一个启动脚本
[root@localhost ~]# vim /usr/bin/elasticsearch-head
#!/bin/bash
#desc: elasticsearch-head service manager
#date: 2019data="cd /usr/local/src/elasticsearch-head/; nohup npm run start > /dev/null 2>&1 & "function START (){eval $data && echo -e "elasticsearch-head start\033[32m     ok\033[0m"
}function STOP (){ps -ef |grep grunt |grep -v "grep" |awk '{print $2}' |xargs kill -s 9 > /dev/null && echo -e "elasticsearch-head stop\033[32m      ok\033[0m"
}case "$1" instart)START;;stop)STOP;;restart)STOPsleep 3START;;*)echo "Usage: elasticsearch-head (start|stop|restart)";;
esac
[root@localhost ~]# chmod +x /usr/bin/elasticsearch-head
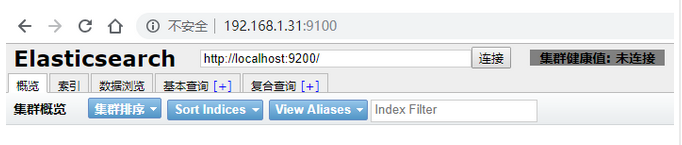
2)浏览器访问9100端口,将连接地址修改为elasticsearch地址。

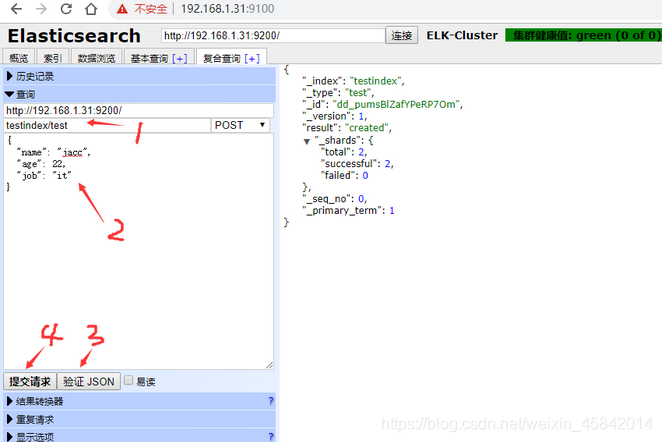
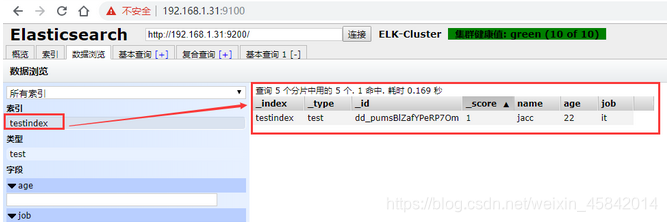
3)测试提交数据
4)验证索引是否存在
5)查看数据
6)Master和Slave的区别:
Master的职责:
-
统计各node节点状态信息、集群状态信息统计、索引的创建和删除、索引分配的管理、关闭node节点等
Savle的职责: -
同步数据、等待机会成为Master
四. Logstash部署
Logstash 是一个开源的数据收集引擎,可以水平伸缩,而且logstash是整个ELK当中拥有最多插件的一个组件,其可以接收来自不同来源的数据并同意输出到指定的且可以是多个不同目的地。官网下载地址:https://www.elastic.co/cn/downloads/past-releases#logstash
1、安装logstash
[root@localhost ~]# wget https://artifacts.elastic.co/downloads/logstash/logstash-6.8.1.rpm
[root@localhost ~]# yum -y localinstall logstash-6.8.1.rpm
2、测试logstash是否正常
[root@localhost ~]# vim /etc/logstash/conf.d/messages.conf input {file {path => "/var/log/messages"type => "msg-log"start_position => "beginning"}
}output {elasticsearch {hosts => "192.168.194.130:9200"index => "msg_log-${+YYYY.MM.dd}"}
}
3. 启动logstash
[root@localhost ~]# systemctl start logstash
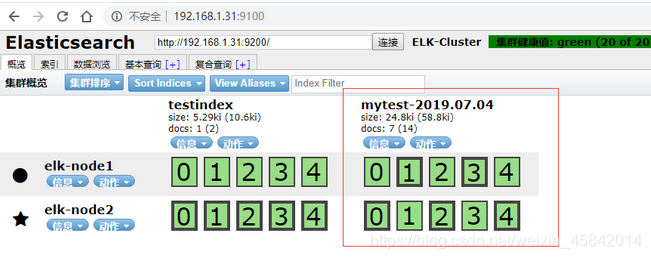
4. elasticsearch服务器验证收到数据
[root@localhost ~]# ll /elk/data/nodes/0/indices/
总用量 0
drwxr-xr-x. 8 elasticsearch elasticsearch 65 7月   4 17:23 4jaihRq6Qu6NQWVxbuRQZg
drwxr-xr-x. 8 elasticsearch elasticsearch 65 7月   4 17:22 kkd_RCldSeaCX3y1XKzdgA
五. kibana部署
Kibana是一个通过调用elasticsearch服务器进行图形化展示搜索结果的开源项目。官网下载地址:https://www.elastic.co/cn/downloads/past-releases#kibana
1、安装kibana
[root@localhost ~]# wget https://artifacts.elastic.co/downloads/kibana/kibana-6.8.1-x86_64.rpm
[root@localhost ~]# yum -y localinstall kibana-6.8.1-x86_64.rpm
[root@localhost ~]# vim /etc/kibana/kibana.yml
[root@localhost ~]# grep ^[a-Z] /etc/kibana/kibana.yml
server.port: 5601    #监听端口
server.host: "192.168.1.100"    #监听地址
elasticsearch.hosts: ["http://192.168.1.100:9200"]    #elasticsearch服务器地址
i18n.locale: "zh-CN"    #修改为中文
2、启动kibana并验证
[root@localhost ~]# systemctl start kibana
[root@localhost ~]# systemctl enable kibana
[root@localhost ~]# ss -nlt  |grep 5601
LISTEN     0      128    192.168.1.100:5601
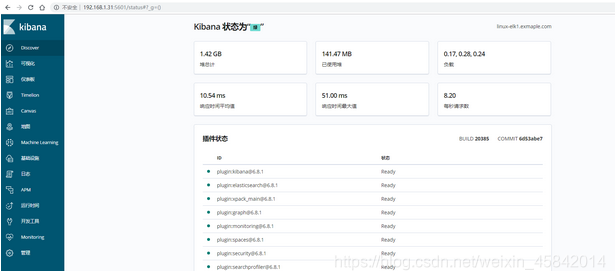
3、查看状态
五、通过logstash收集系统message日志
说明:通过logstash收集别的日志文件,前提需要logstash用户对被收集的日志文件有读的权限并对写入的文件有写的权限
1)配置logstash配置文件
[root@localhost ~]# vim /etc/logstash/conf.d/system-log.conf
input {file {path => "/var/log/messages"    #日志路径type => "systemlog"            #类型,自定义,在进行多个日志收集存储时可以通过该项进行判断输出start_position => "beginning"        #logstash 从什么位置开始读取文件数据,默认是结束位置,也就是说 logstash 进程会以类似 tail -F 的形式运行。如果你是要导入原有数据,把这个设定改成 "beginning",logstash 进程就从头开始读取,类似 less +F 的形式运行。stat_interval => "2"    #logstash 每隔多久检查一次被监听文件状态(是否有更新),默认是 1 秒}
}output {elasticsearch {hosts => ["192.168.194.130:9200"]        #elasticsearch服务器地址index => "logstash-%{type}-%{+YYYY.MM.dd}"    #索引名称}
}
2)检测配置文件语法是否有错误
[root@localhost ~]# /usr/share/logstash/bin/logstash -f /etc/logstash/conf.d/system-log.conf -t    #检测配置文件是否有语法错误
WARNING: Could not find logstash.yml which is typically located in $LS_HOME/config or /etc/logstash. You can specify the path using --path.settings. Continuing using the defaults
Could not find log4j2 configuration at path /usr/share/logstash/config/log4j2.properties. Using default config which logs errors to the console
[WARN ] 2019-07-05 10:09:59.423 [LogStash::Runner] multilocal - Ignoring the 'pipelines.yml' file because modules or command line options are specified
Configuration OK
[INFO ] 2019-07-05 10:10:27.993 [LogStash::Runner] runner - Using config.test_and_exit mode. Config Validation Result: OK. Exiting Logstash
3)修改日志文件的权限并重启logstash
[root@localhost ~]# ll /var/log/messages
-rw-------. 1 root root 786219 7月   5 10:10 /var/log/messages
#这里可以看到该日志文件是600权限,而elasticsearch是运行在elasticsearch用户下,这样elasticsearch是无法收集日志的。所以这里需要更改日志的权限,否则会报权限拒绝的错误。在日志中查看/var/log/logstash/logstash-plain.log 是否有错误。
[root@localhost ~]# chmod 644 /var/log/messages
[root@localhost ~]# systemctl  restart logstash
4)elasticsearch界面查看并查询
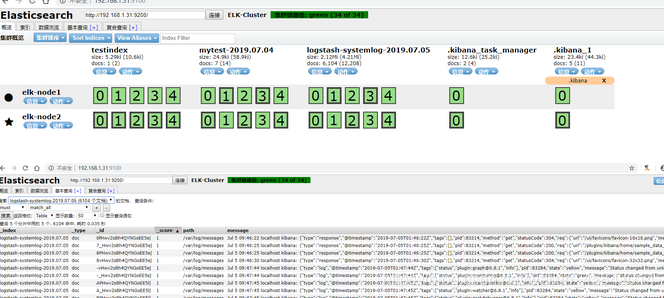
5)kibana界面创建索引并查看
六、ELK快速入门二-通过logstash收集日志
收集多个日志文件
1)logstash配置文件编写
[root@localhost ~]# vim /etc/logstash/conf.d/system-log.conf
input {file {path => "/var/log/messages"type => "systemlog"start_position => "beginning"stat_interval => "3"}file {path => "/var/log/secure"type => "securelog"start_position => "beginning"stat_interval => "3"}
}output {if [type] == "systemlog" {elasticsearch {hosts => ["192.168.1.100:9200"]index => "system-log-%{+YYYY.MM.dd}"}}if [type] == "securelog" {elasticsearch {hosts => ["192.168.1.100:9200"]index => "secure-log-%{+YYYY.MM.dd}"}}
}
2)给日志文件赋予可读权限并重启logstash
[root@localhost ~]# chmod 644 /var/log/secure
[root@localhost ~]# chmod 644 /var/log/messages
[root@localhost ~]# systemctl restart logstash
3)向被收集的文件中写入数据;是为了马上能在elasticsearch的web界面和klbana的web界面里面查看到数据。
[root@localhost ~]# echo "test" >> /var/log/secure
[root@localhost ~]# echo "test" >> /var/log/messages
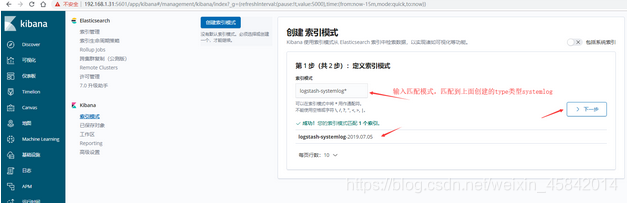
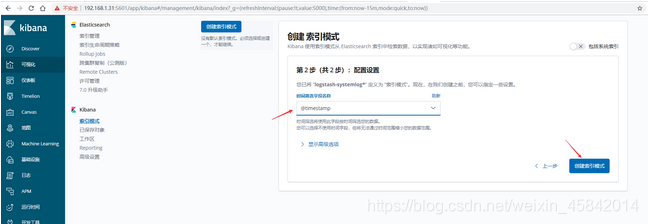
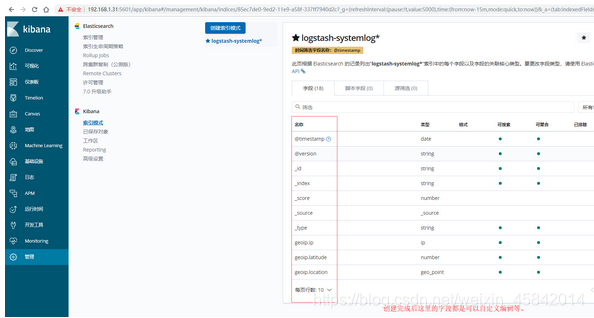
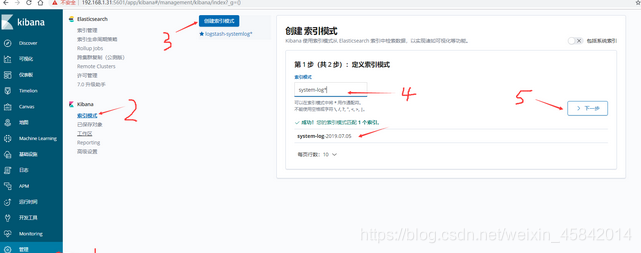
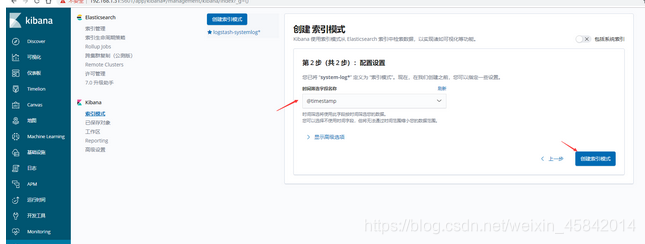
4)在kibana界面添加system-log索引模式
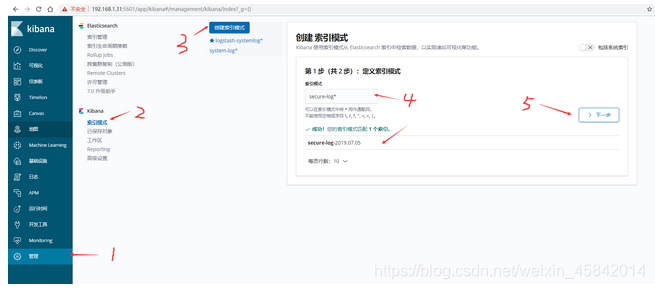
5)在kibana界面添加secure-log索引模式
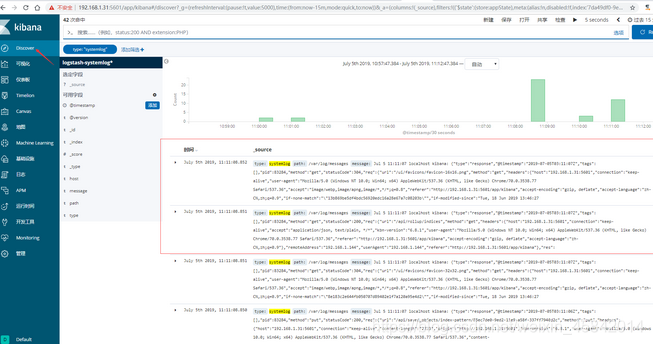
6)kibana查看日志

本文来自互联网用户投稿,文章观点仅代表作者本人,不代表本站立场,不承担相关法律责任。如若转载,请注明出处。 如若内容造成侵权/违法违规/事实不符,请点击【内容举报】进行投诉反馈!