jq+css+echarts——实现echarts中的水球效果——技能提升
最近在写看板,经常用到下面的百分率的展示形式。也可能是用饼图展示的。
看板中经常用到下图中的水球样式:其实就是个百分率的展示;
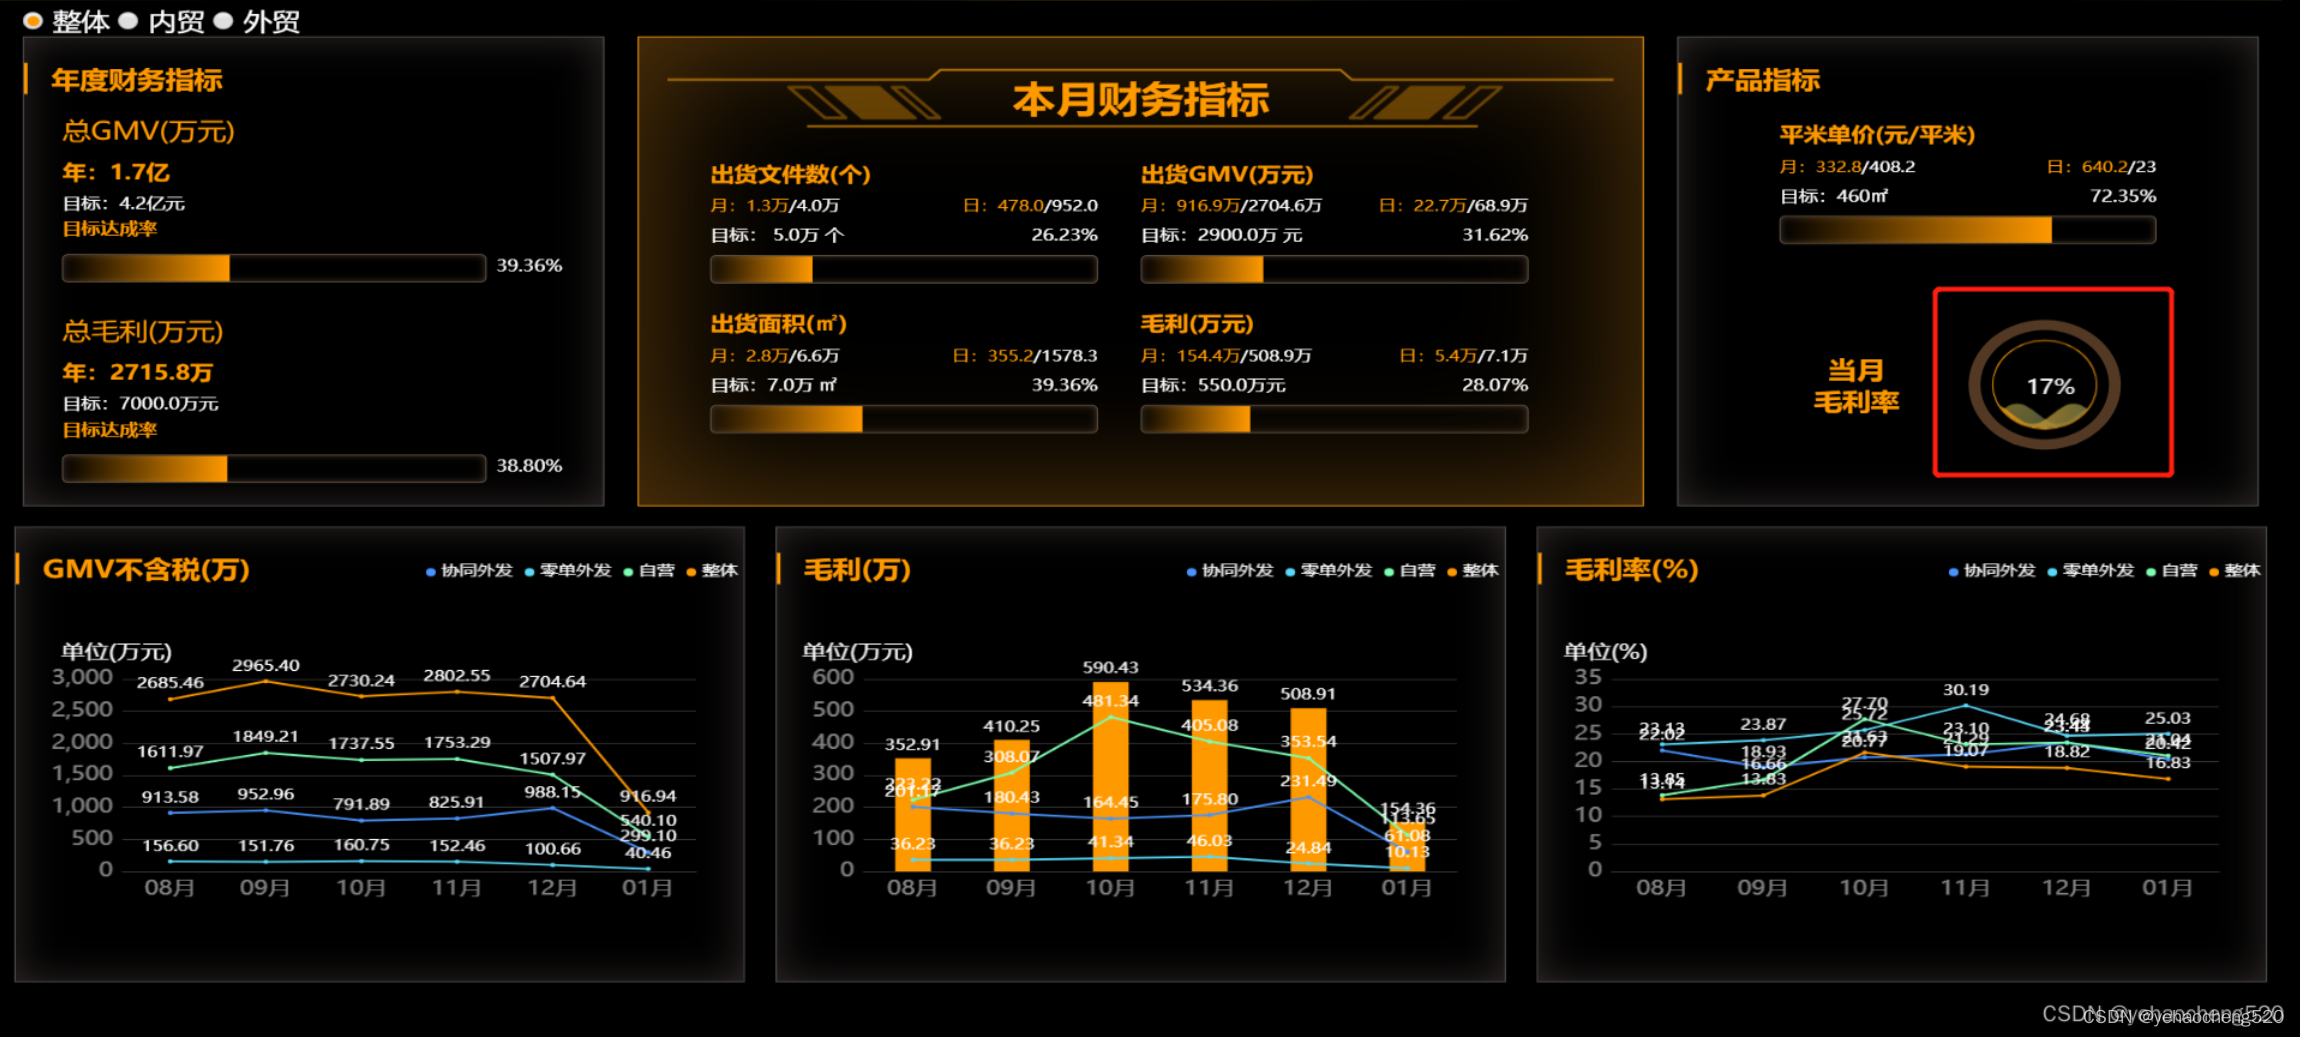
水球样式和饼图的区分:
水球里面是有个水波纹的动效的,除此之外,基本都是一样的。
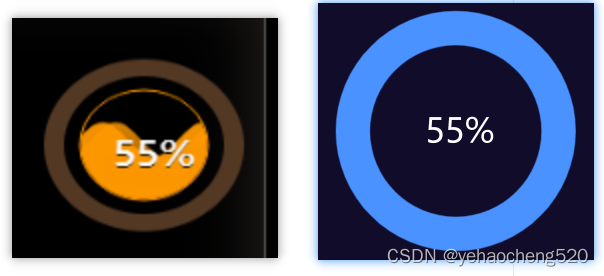
分析一下上图中的水球:
1.外面的一圈:其实是通过border来实现的
2.里面的圆圈+百分比+波纹展示:通过echarts中的水球样式可以实现
1.引入jq+echarts+echarts-liquidfill文件——请百度后自行下载以下的文件
如果需要以下的文件,可以留个邮箱,我看到后会发到指定邮箱里面
<script src="/Scripts/jquery-3.4.1.min.js"></script>
<script src="/Content/plugins/echarts.min.5.0.js"></script>
<script src="~/Content/plugins/echarts-liquidfill.min.js"></script>
2.html代码
 <li class="ballChartsListItem"><div class="fl_txt"><span>当月<br>毛利率</span></div><div class="fr" id="ballCharts_s1"></div>
</li>
3.css代码
.ballChartsListItem {display: flex;justify-content: space-around;align-items: center;width:100%;
}
.fl_txt {font-size: 24px;color: #f90;font-weight: bold;
}
.fr{width: 128px; height: 128px; border-radius: 50%; border: 10px solid #533924; margin: 0 5px;
}
4.jq代码
入参如下:
1. id:显示水球的dom元素的id
2. data:展示的百分比数值,比如30%,传入0.3即可
使用方法:
ballCharts('ballCharts_s1', 0.17);
封装的方法如下:
ballCharts(id, data) {var ball = echarts.init(document.getElementById(id));let obj = {backgroundColor: 'transparent',title: [{text: (data * 100).toFixed(0) + '%',left: '50%',top: '40%',textAlign: 'center',textStyle: {fontSize: '20',fontWeight: '400',color: '#fff',textAlign: 'center',textBorderColor: 'rgba(0, 0, 0, 0)',textShadowColor: '#000',textShadowBlur: '0',textShadowOffsetX: 0,textShadowOffsetY: 1,},},],polar: {radius: ['82%', '80%'],center: ['50%', '50%'],},angleAxis: {max: 100,clockwise: false,axisLine: {show: false,},axisTick: {show: false,},axisLabel: {show: false,},splitLine: {show: false,},},radiusAxis: {type: 'category',show: true,axisLabel: {show: false,},axisLine: {show: false,},axisTick: {show: false,},},series: [{type: 'liquidFill',radius: '80%',z: 1,center: ['50%', '50%'],amplitude: 10,color: {type: 'linear',x: 0,y: 0,x2: 1,y2: 1,colorStops: [{offset: 0,color: '#f90',},{offset: 1,color: 'rgba(68,144,144,.5)',},],globalCoord: false,},data: [data,{value: data,direction: 'left',},],backgroundStyle: {borderWidth: 1,color: 'transparent',},label: {normal: {formatter: '',},},outline: {show: true,itemStyle: {borderWidth: 0,},borderDistance: 0,},},{name: '',type: 'bar',roundCap: true,showBackground: true,backgroundStyle: {color: '#15181e',},data: [150],coordinateSystem: 'polar',color: "#f90",},],}ball.setOption(obj);};
完成!!!多多积累,多多收获!
本文来自互联网用户投稿,文章观点仅代表作者本人,不代表本站立场,不承担相关法律责任。如若转载,请注明出处。 如若内容造成侵权/违法违规/事实不符,请点击【内容举报】进行投诉反馈!