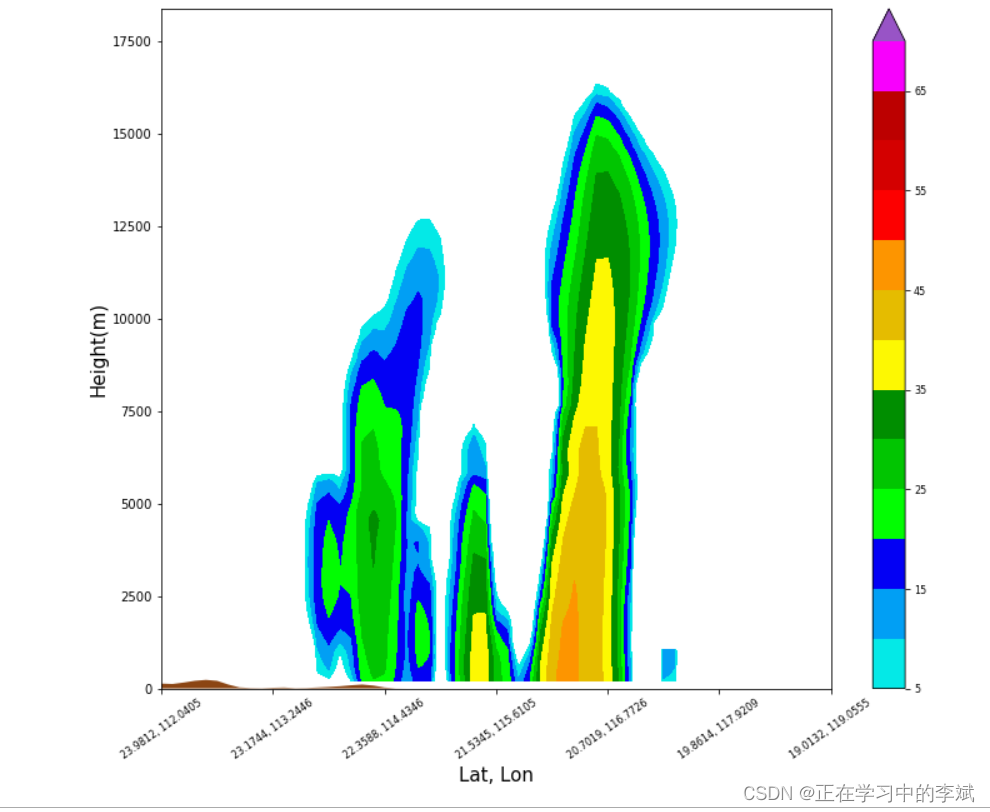
# 插值前转化成对数
z_log =10**(dbz/10.)# Use linear Z for interpolation# 插值至垂直剖面
z_cross = vertcross(z_log, ht, wrfin=wrf_file,start_point=cross_start,end_point=cross_end,latlon=True, meta=True)# 插值后转换回来
dbz_cross =10.0* np.log10(z_cross)# 前面的操作使变量丢失属性,将属性添加回去
dbz_cross.attrs.update(dbz.attrs)
dbz_cross.attrs["description"]="radar reflectivity cross section"
dbz_cross.attrs["units"]="dBZ"
5. 插值地形高度至cross line
# 插值地形高度至cross line
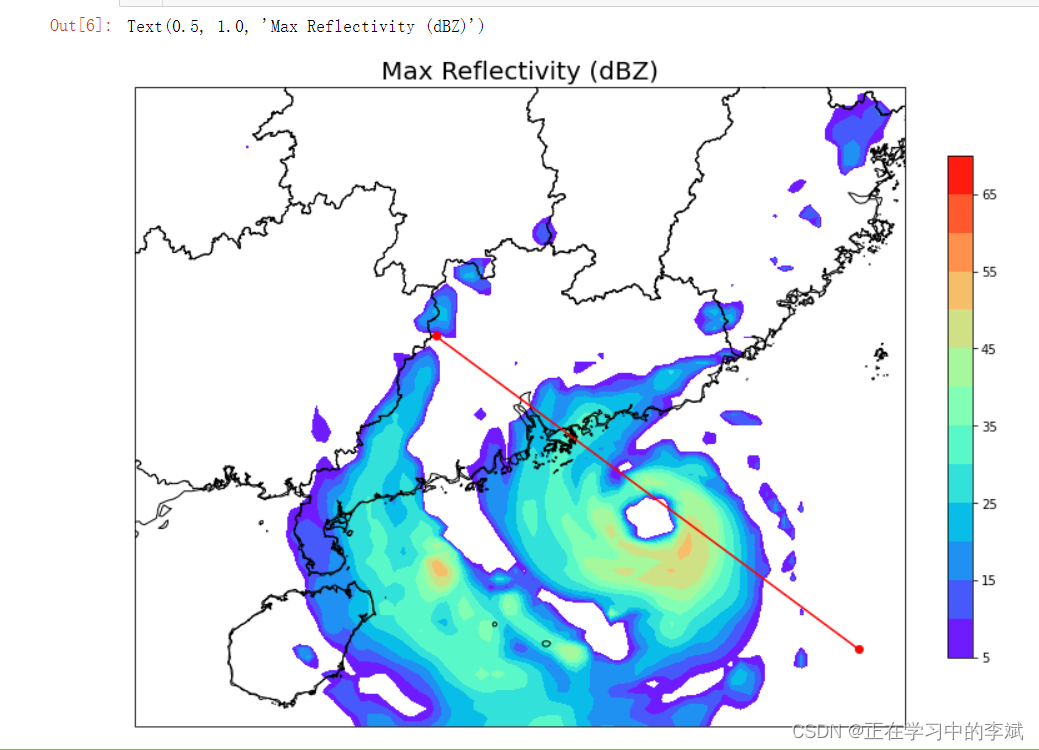
ter_line = interpline(ter, wrfin=wrf_file, start_point=cross_start,end_point=cross_end)
6.绘制垂直剖面dbz
# 插值地形高度至cross line
fig = plt.figure(figsize=(12,10))
ax_cross = fig.add_subplot(1,1,1)########################### 绘制垂直剖面dbz
dbz_levels = np.arange(5.,75.,5.)# 14个区间# Create the color table found on NWS pages. # 14个区间
dbz_rgb = np.array([[4,233,231],[1,159,244],[3,0,244],[2,253,2],[1,197,1],[0,142,0],[253,248,2],[229,188,0],[253,149,0],[253,0,0],[212,0,0],[188,0,0],[248,0,253],[152,84,198]], np.float32)/255.0#是一个辅助函数,可以帮助创建cmap和norm实例,其行为类似于Contourf的level和colors参数的行为
dbz_cmap, dbz_norm = from_levels_and_colors(dbz_levels, dbz_rgb,extend="max")xs = np.arange(0, dbz_cross.shape[-1],1)
ys = to_np(dbz_cross.coords["vertical"])
dbz_np = to_np(dbz_cross)
dbz_contours = ax_cross.contourf(xs,ys[0:90],dbz_np[0:90,:],levels=dbz_levels,cmap=dbz_cmap,norm=dbz_norm,extend="max")# Add the color bar
cb_dbz = fig.colorbar(dbz_contours, ax=ax_cross)
cb_dbz.ax.tick_params(labelsize=8)# Fill in the mountain area
ht_fill = ax_cross.fill_between(xs,0, to_np(ter_line),facecolor="saddlebrown")# Set the x-ticks to use latitude and longitude labels
coord_pairs = to_np(dbz_cross.coords["xy_loc"])
x_ticks = np.arange(coord_pairs.shape[0])
x_labels =[pair.latlon_str()for pair in to_np(coord_pairs)]thin =10
ax_cross.set_xticks(x_ticks[::thin])
ax_cross.set_xticklabels(x_labels[::thin], rotation=35, fontsize=8)# Set the x-axis and y-axis labels
ax_cross.set_xlabel("Lat, Lon", fontsize=15)
ax_cross.set_ylabel("Height(m)", fontsize=15)plt.savefig("wrf_cross_dbz.png")
plt.show()