SpringBoot2.x整合Prometheus+Grafana【附源码】
图文并茂,新手入门教程,建议收藏
SpringBoot2.x整合Prometheus+Grafana【附源码】
附源码+视频
文章目录
- 工程简介
- 简介
- Prometheus
- grafana
- SpringBoot工程初始化
- 环境安装
- Prometheus安装
- Grafana安装
- 整合
- 延伸阅读
- 中级篇
- 实战篇
工程简介
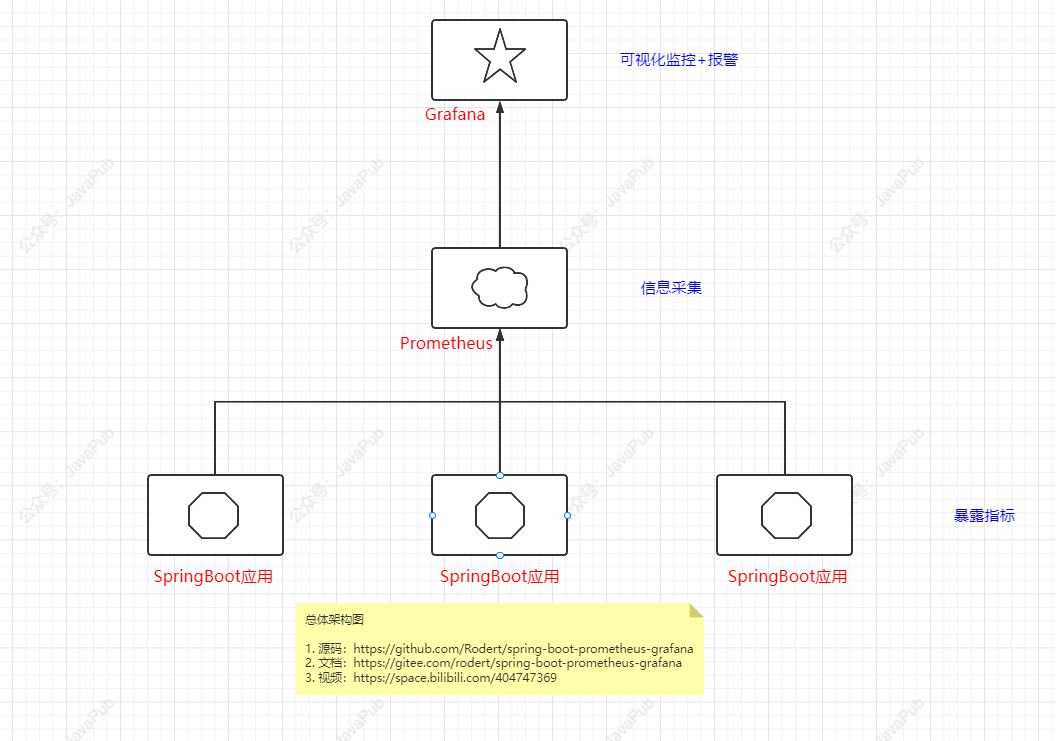
总体框架图
简介
Prometheus
Prometheus,是一个开源的系统监控和告警的工具包,其采用Pull方式采集时间序列的度量数据(也支持push方式),通过Http协议传输。它的工作方式是被监控的服务需要公开一个Prometheus端点,这端点是一个HTTP接口,该接口公开了度量的列表和当前的值,然后Prometheus应用从此接口定时拉取数据,一般可以存放在时序数据库中,然后通过可视化的Dashboard(e.g.Grafana)进行数据展示。
支持的prometheus metrics
Counter,Gauge,Histogram,Summary,untyped等等。需要注意的是counter只能增不能减,适用于服务请求量,用户访问数等统计,但是如果需要统计有增有减的指标需要用Gauge。
exporter
支持的 exporter 很多,可以方便的监控很多应用,同时也可以自定义开发非官方提供的exporter。
grafana
grafana,是一个开源的dashboard展示工具,可以支持很多主流数据源,包括时序性的和非时序性的。其提供的展示配置以及可扩展性能满足绝大部分时间序列数据展示需求,是一个比较优秀的工具。
支持的数据源
prometheus,inflexdb,elasticsearch,mysql,postgreSQL,openTSDB等,更多数据源:https://grafana.com/grafana/plugins/?type=datasource
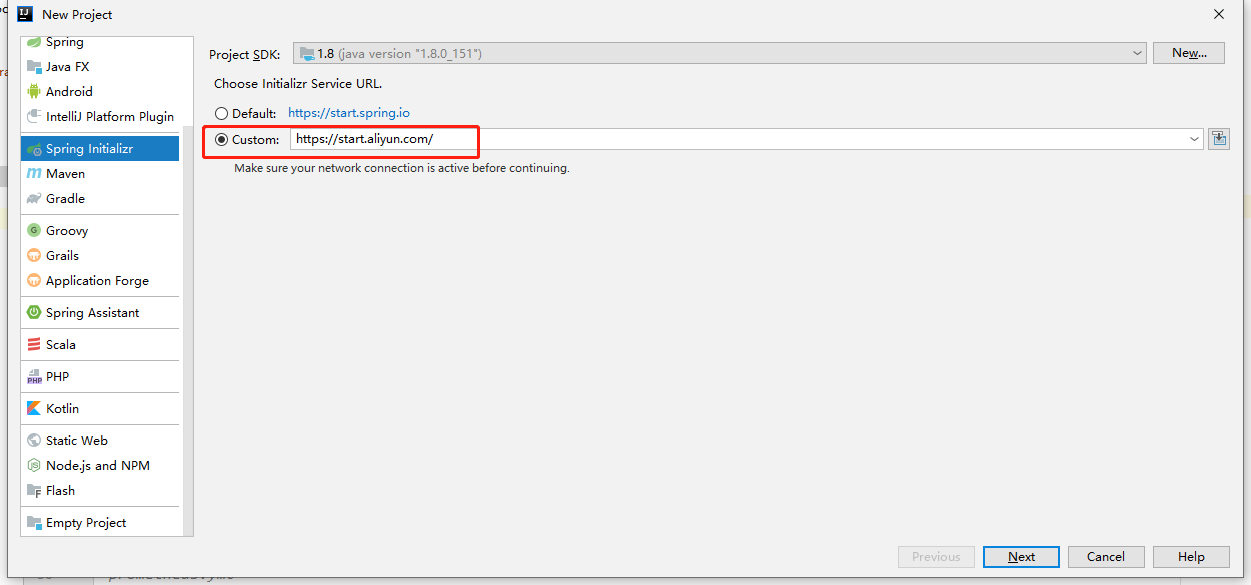
SpringBoot工程初始化
springboot加速初始化:https://start.aliyun.com/
添加依赖
pom.xml
<dependency><groupId>org.springframework.bootgroupId><artifactId>spring-boot-starter-actuatorartifactId>dependency><dependency><groupId>io.micrometergroupId><artifactId>micrometer-registry-prometheusartifactId>dependency><dependency><groupId>org.springframework.bootgroupId><artifactId>spring-boot-starter-webartifactId>dependency>
配置信息
在application.yml增加以下配置项
##SpringBoot2.x整合Prometheus+Grafana
##源码:https://github.com/Rodert/SpringBoot-javapub
management:metrics:export:prometheus:enabled: truestep: 1mdescriptions: trueweb:server:auto-time-requests: trueendpoints:prometheus:id: springmetricsweb:exposure:include: health,info,env,prometheus,metrics,httptrace,threaddump,heapdump,springmetrics
server:port: 8080
启动SpringBoot应用
http://localhost:8080/actuator/prometheus
打开即可看到暴露的信息

环境安装
如安装包下载不成功,可以在公众号回复【prometheus安装包】or【grafana安装包】领取
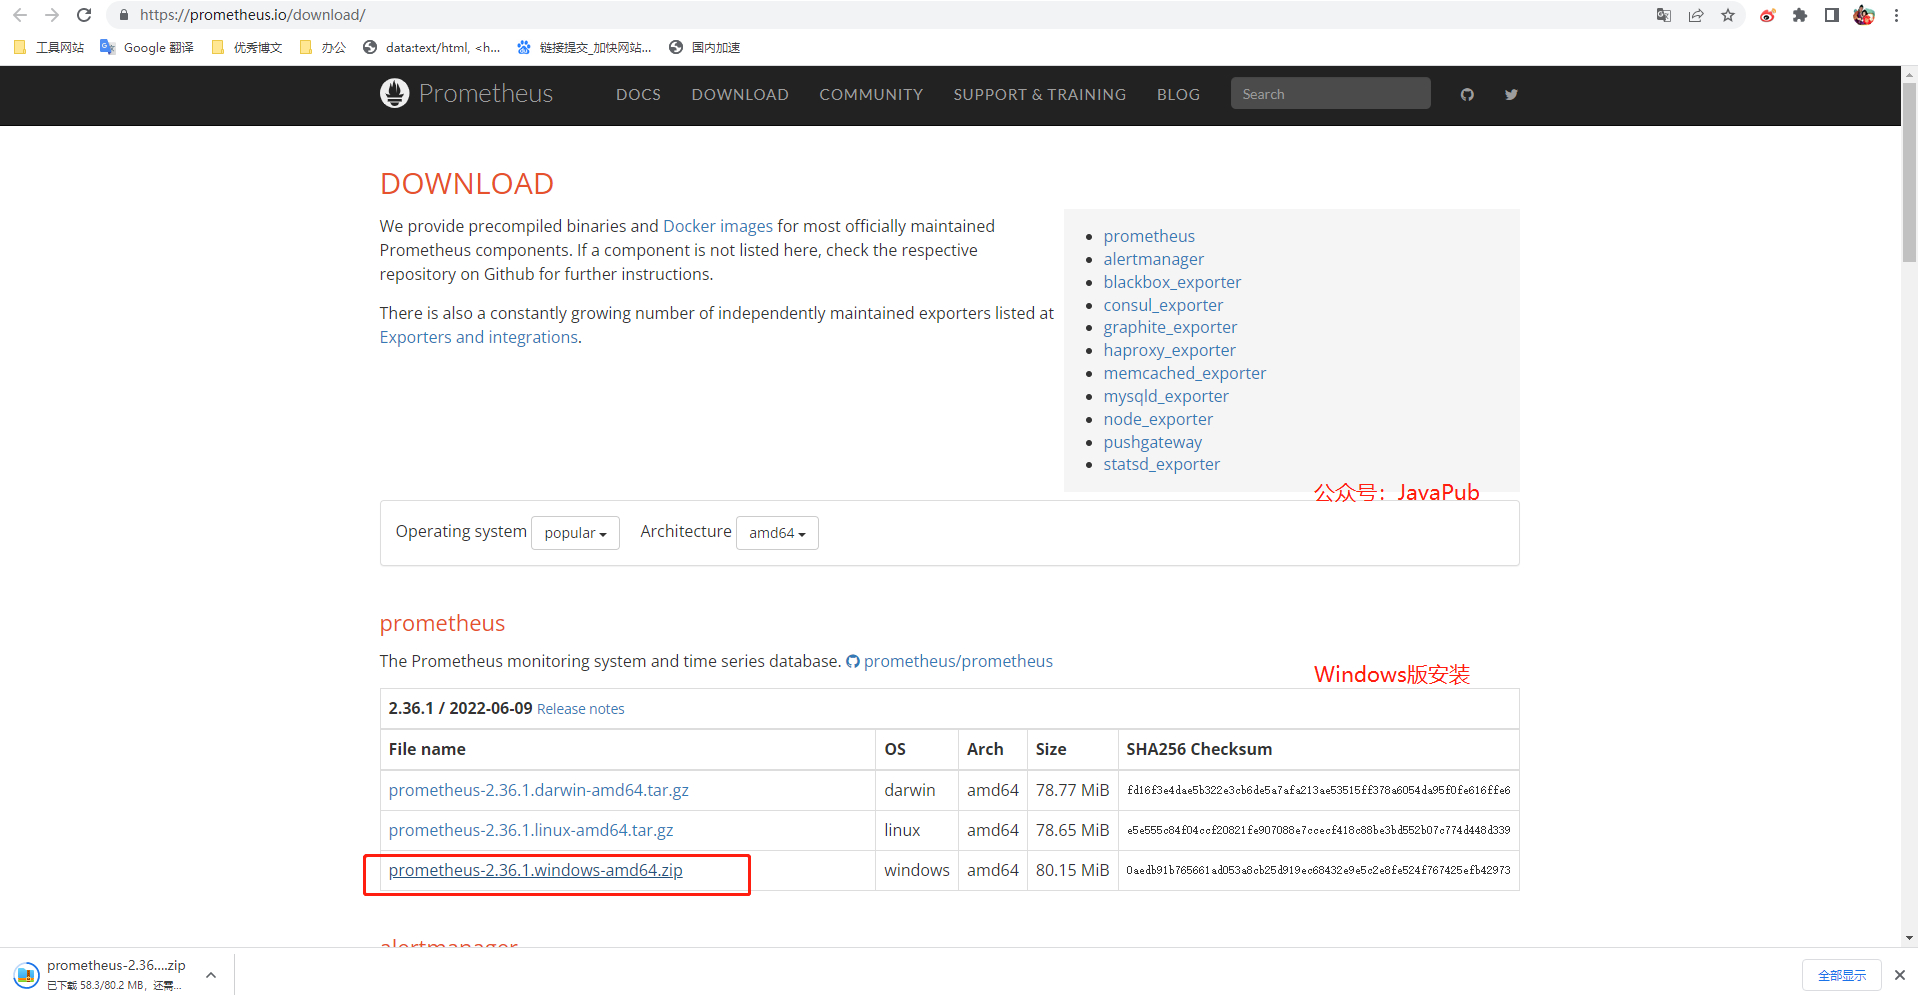
Prometheus安装
下载地址:https://prometheus.io/download/
修改配置:
prometheus.yml
# my global config
global:scrape_interval: 15s # Set the scrape interval to every 15 seconds. Default is every 1 minute.evaluation_interval: 15s # Evaluate rules every 15 seconds. The default is every 1 minute.# scrape_timeout is set to the global default (10s).# Alertmanager configuration
alerting:alertmanagers:- static_configs:- targets:# - alertmanager:9093# Load rules once and periodically evaluate them according to the global 'evaluation_interval'.
rule_files:# - "first_rules.yml"# - "second_rules.yml"# A scrape configuration containing exactly one endpoint to scrape:
# Here it's Prometheus itself.
scrape_configs:# The job name is added as a label `job=` to any timeseries scraped from this config. - job_name: 'prometheus'# metrics_path defaults to '/metrics'# scheme defaults to 'http'.#暴露路径metrics_path: /actuator/prometheusstatic_configs:#SpringBoot的ip和端口号- targets: ['localhost:8080']
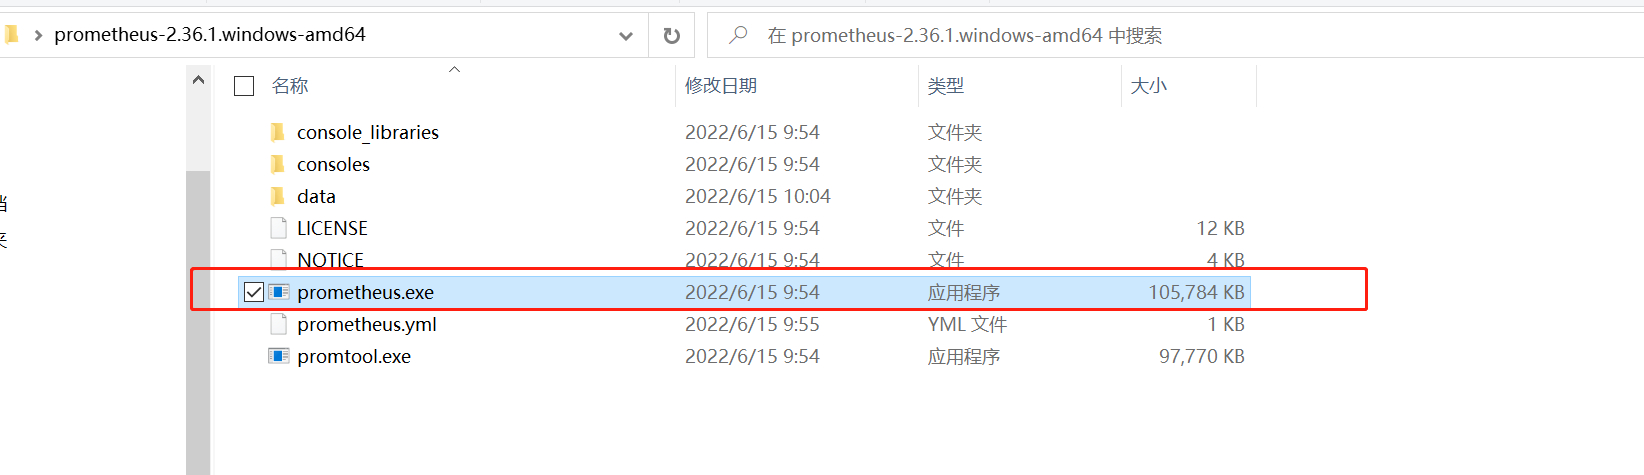
启动Prometheus
prometheus.exe
测试访问
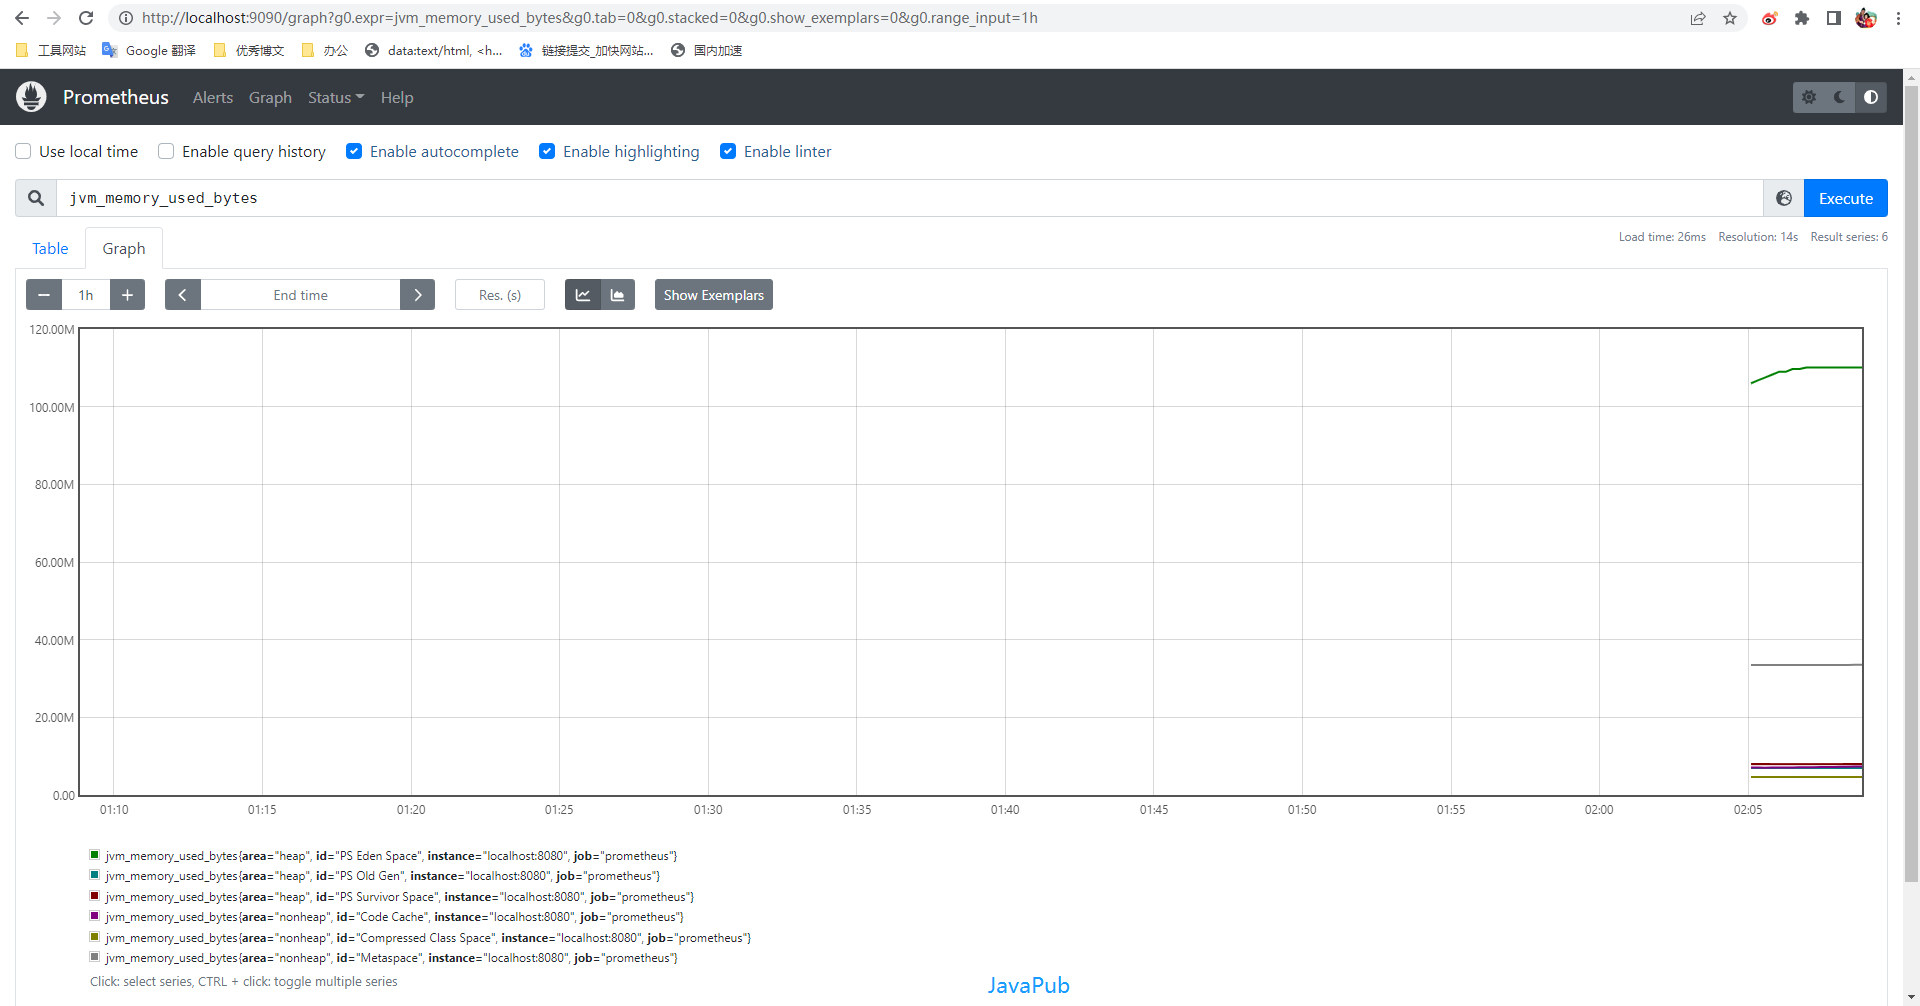
http://localhost:9090
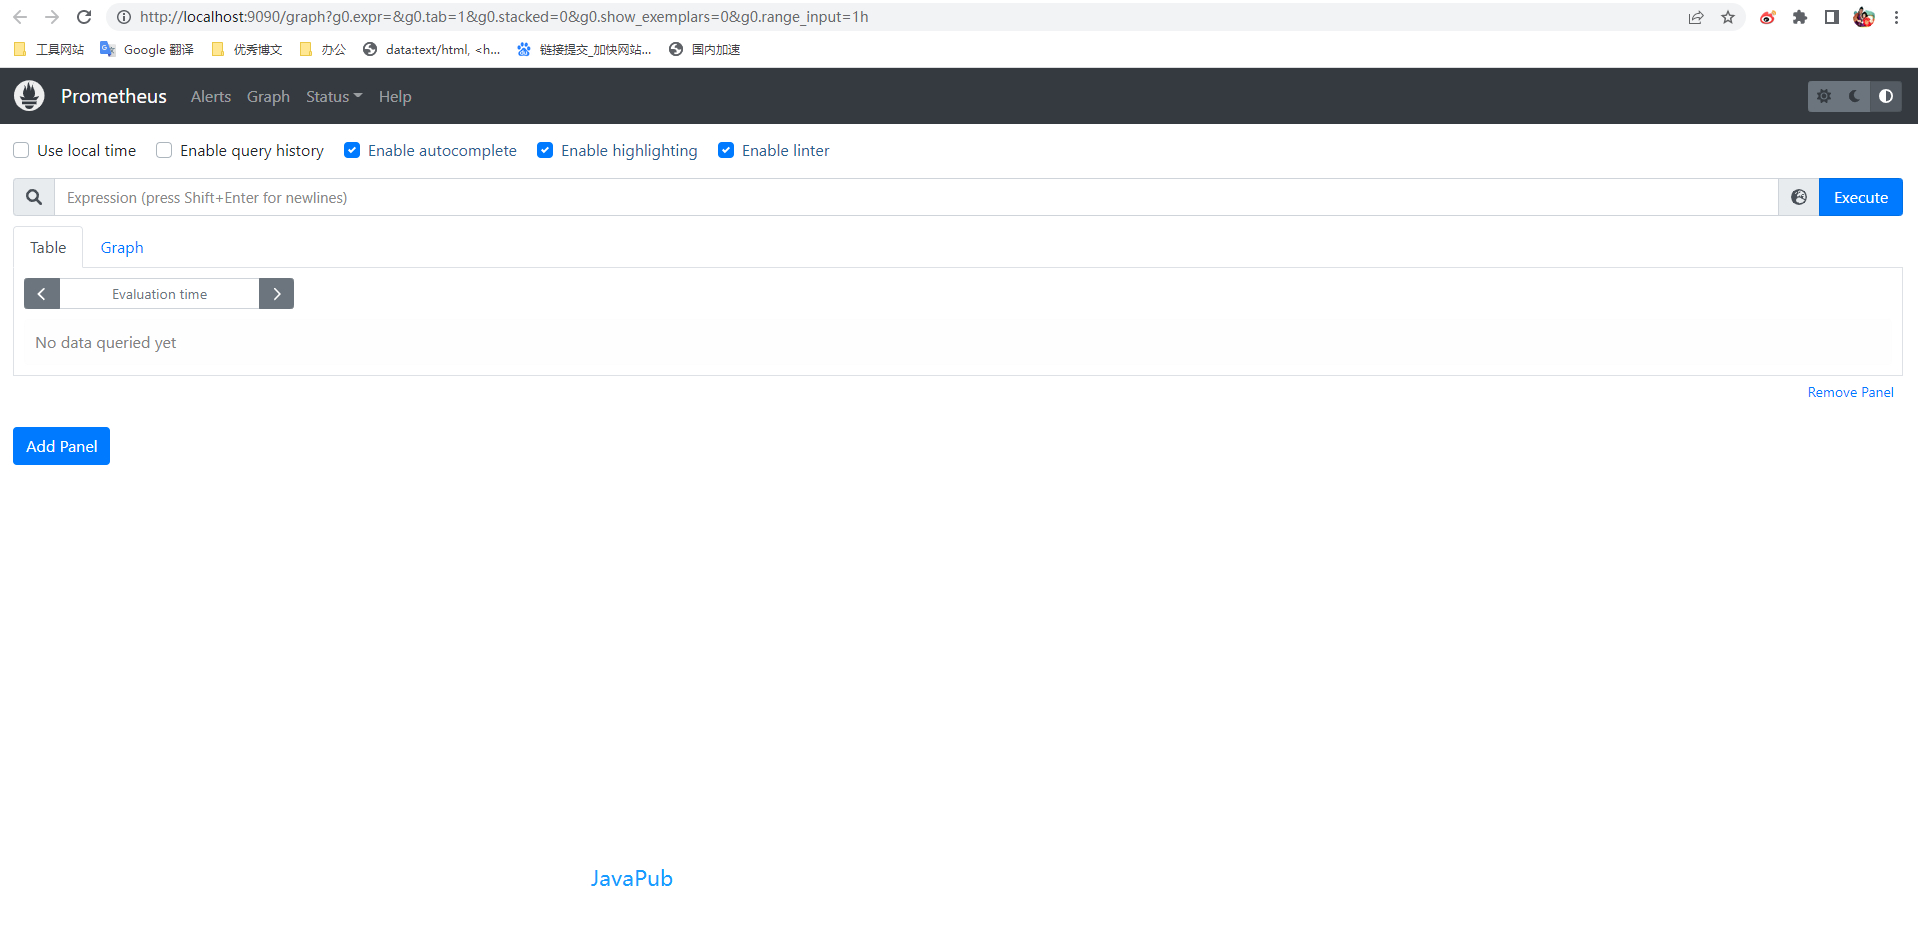
jvm_memory_used_bytes
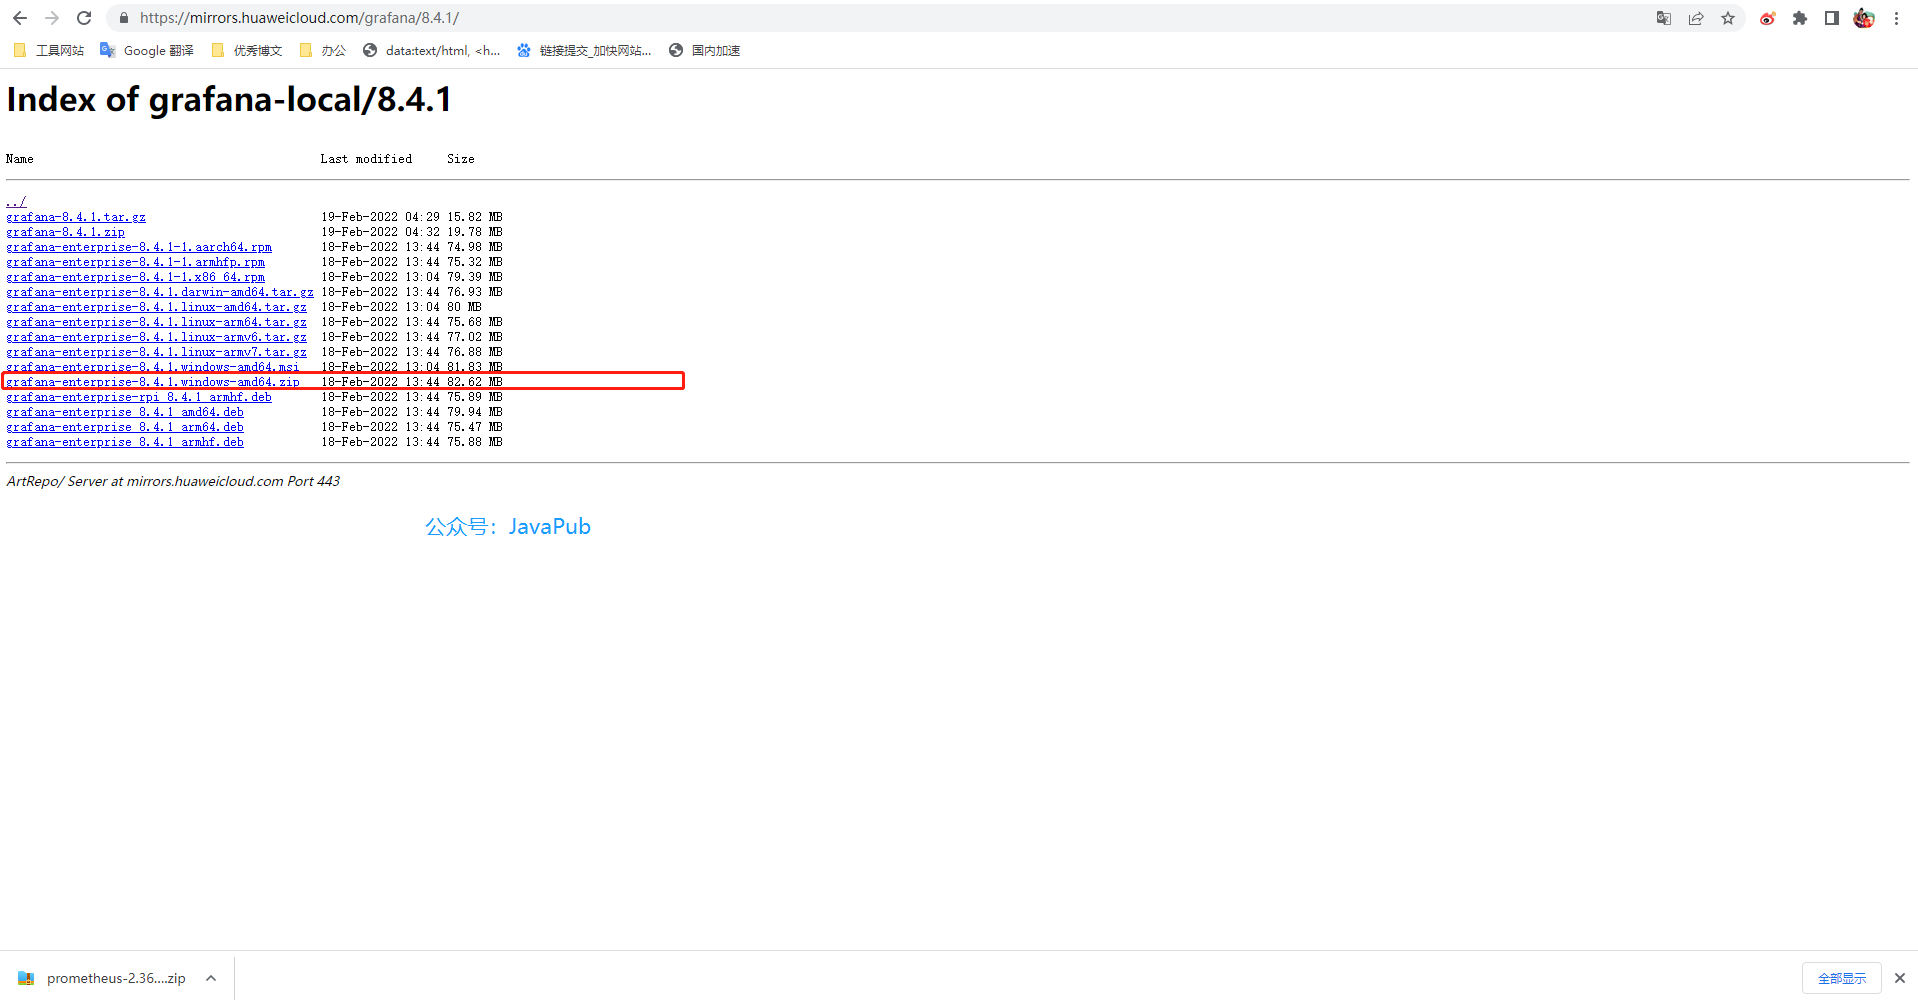
Grafana安装
下载地址:https://mirrors.huaweicloud.com/grafana/
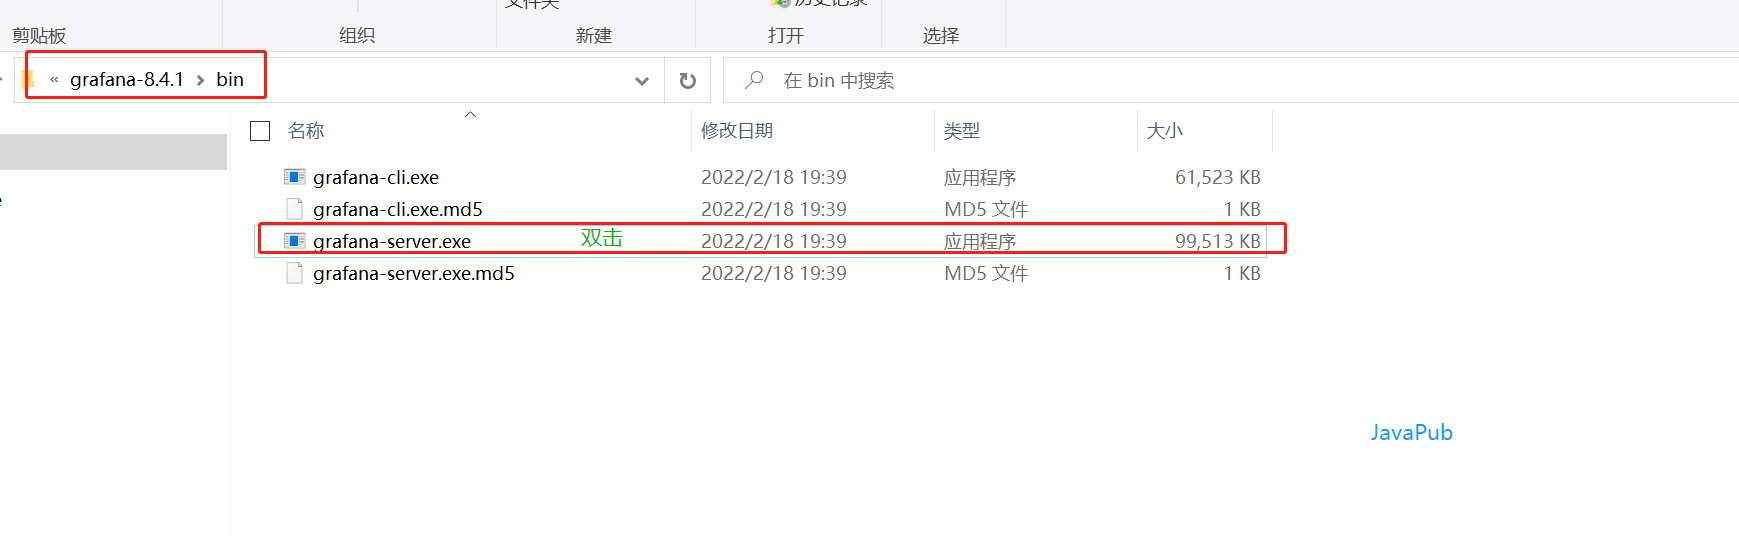
启动grafana
测试
http://127.0.0.1:3000/login

默认账号:admin 密码:admin
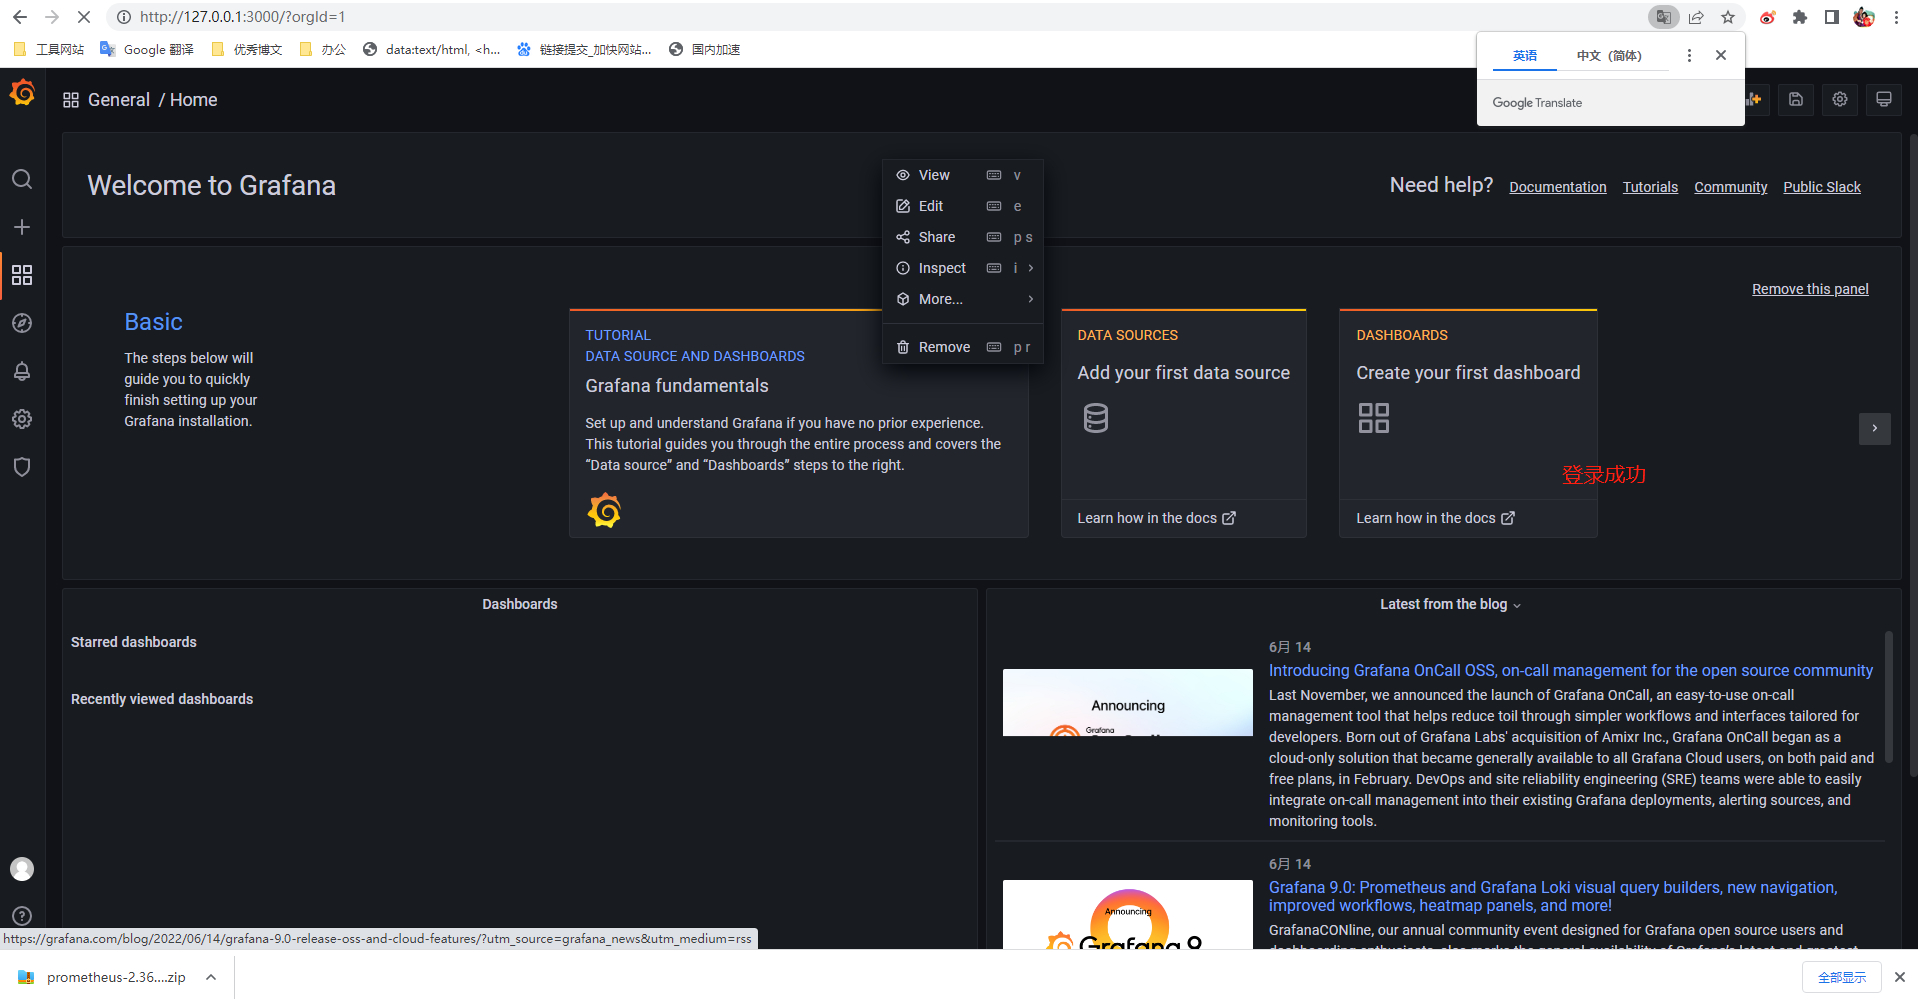
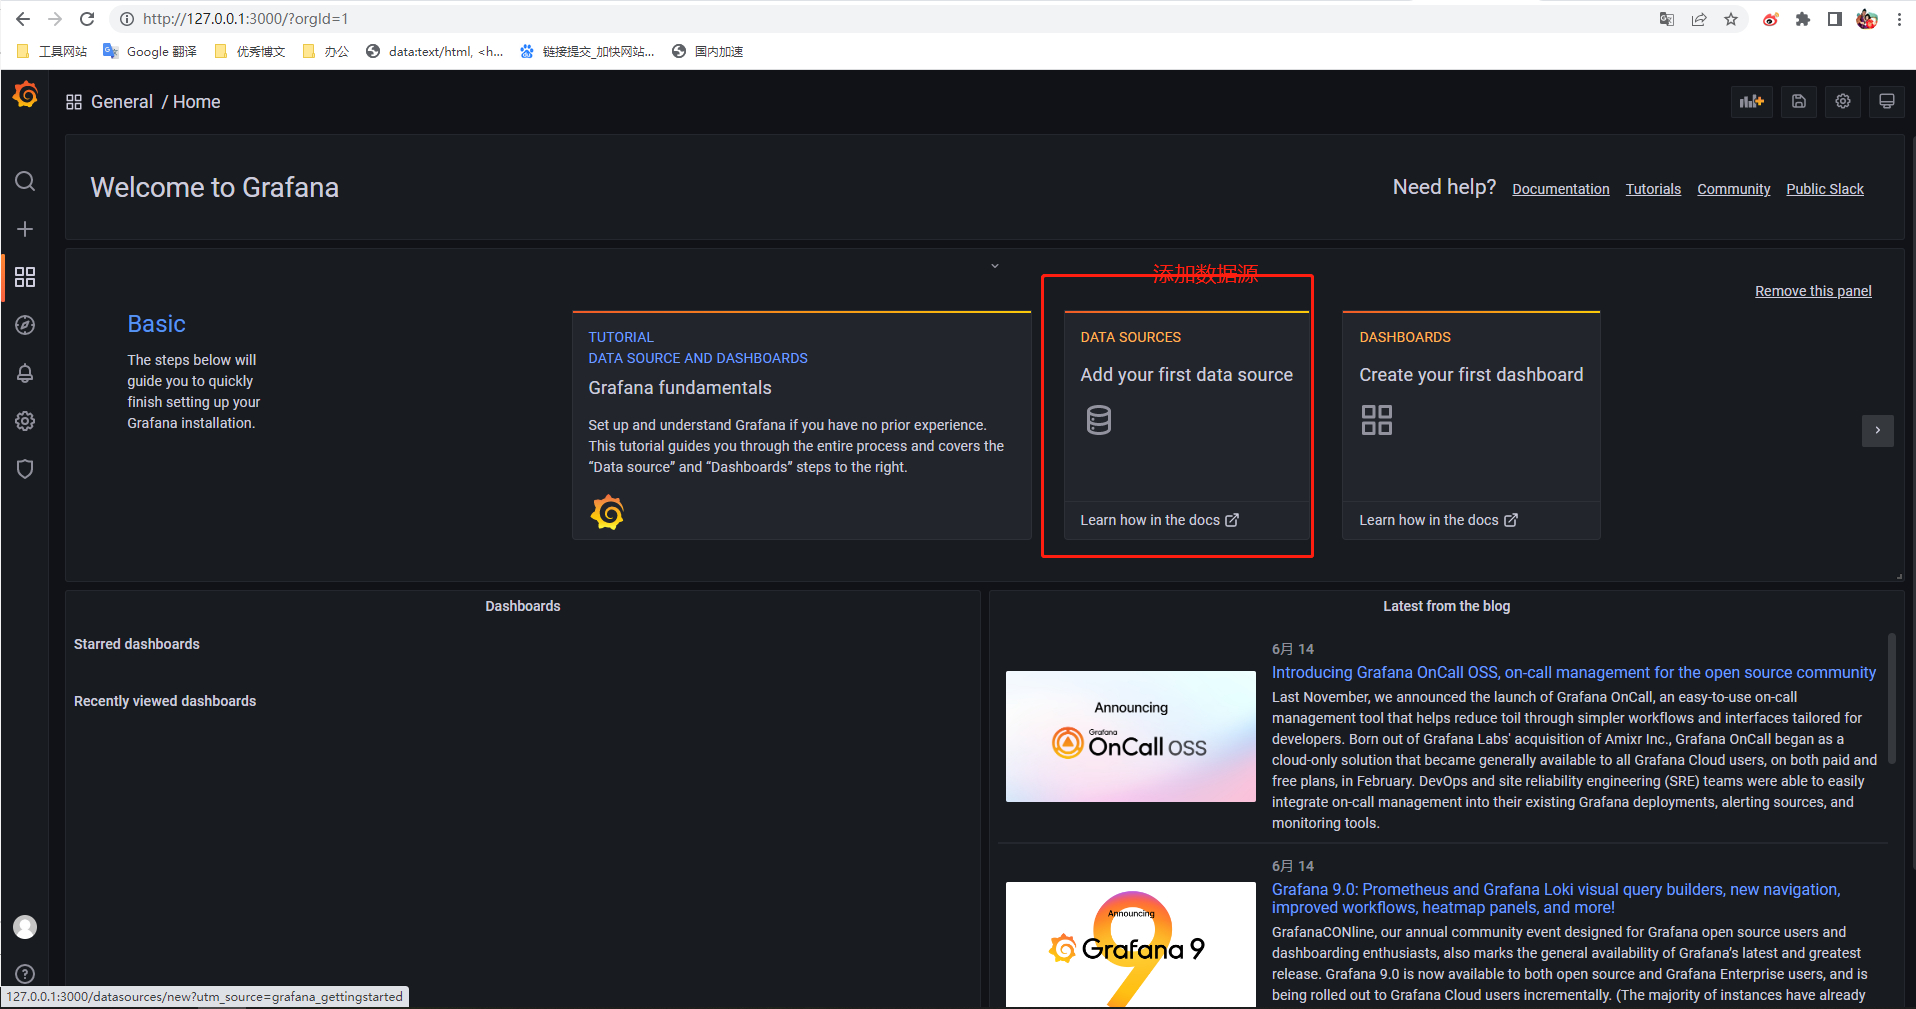
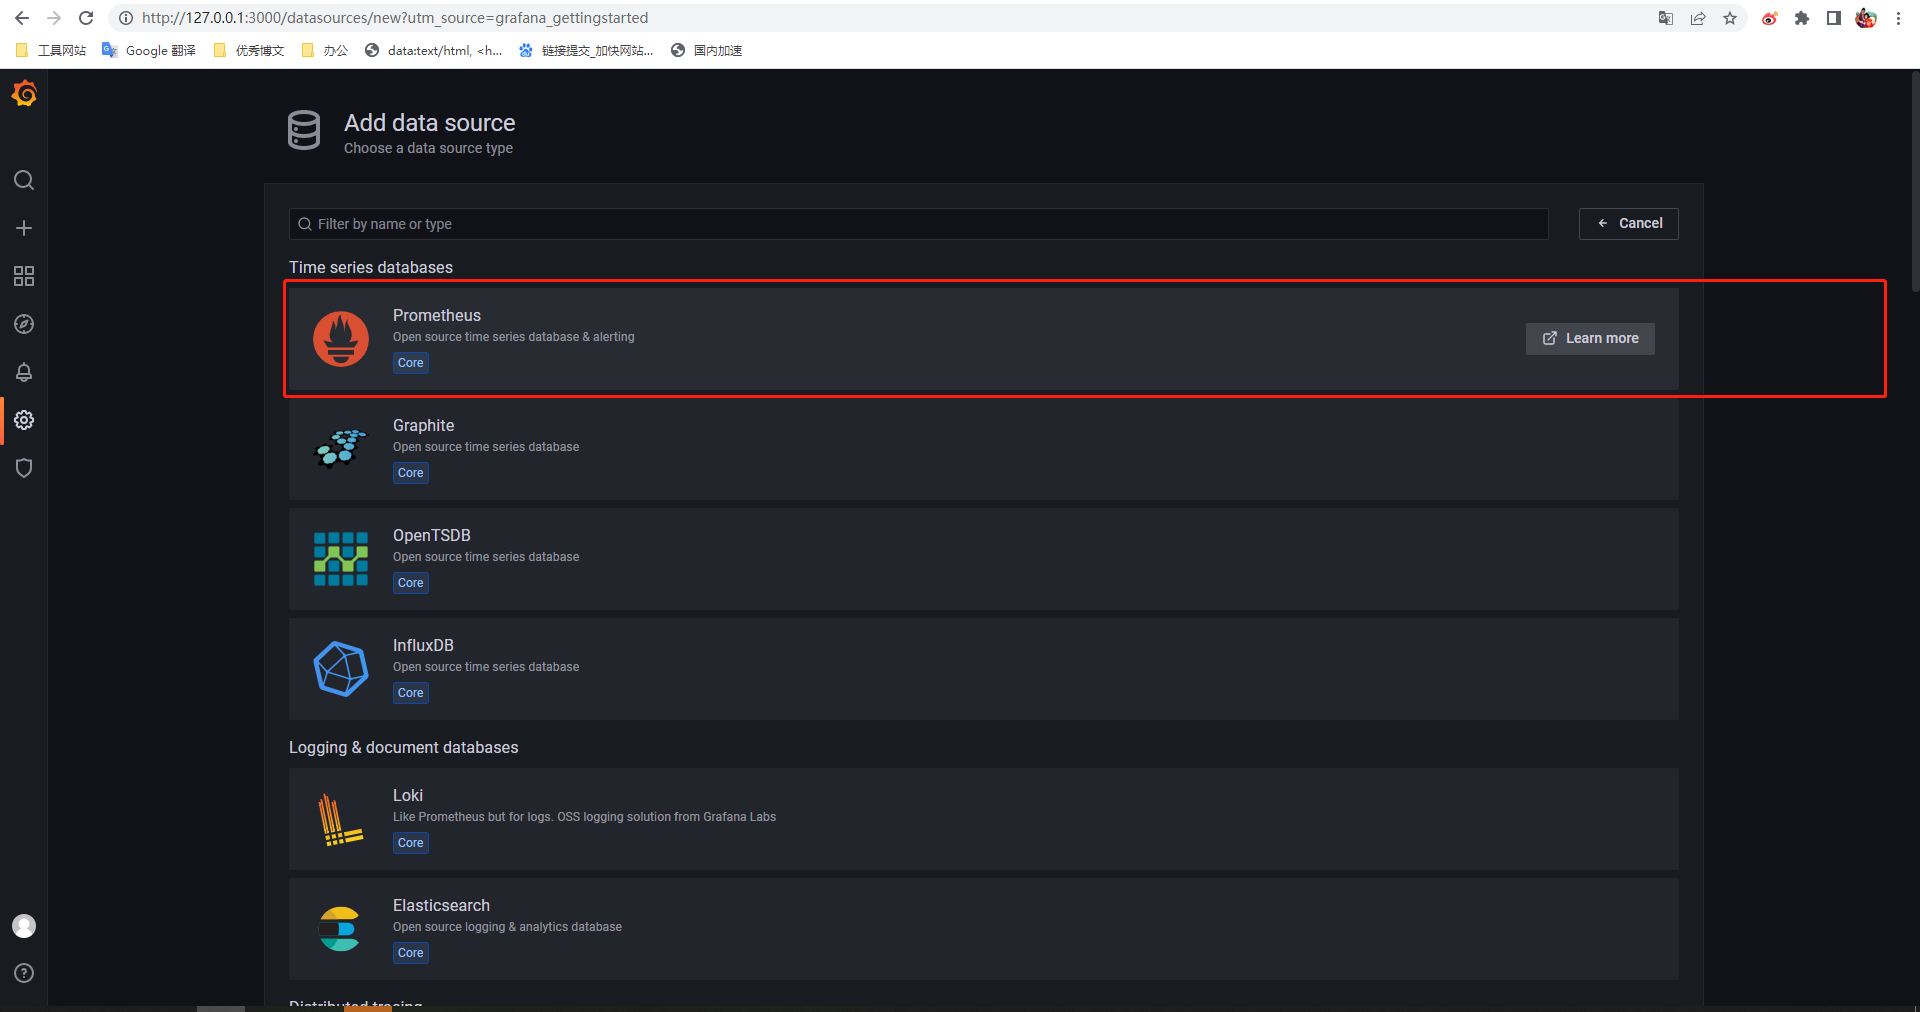
整合
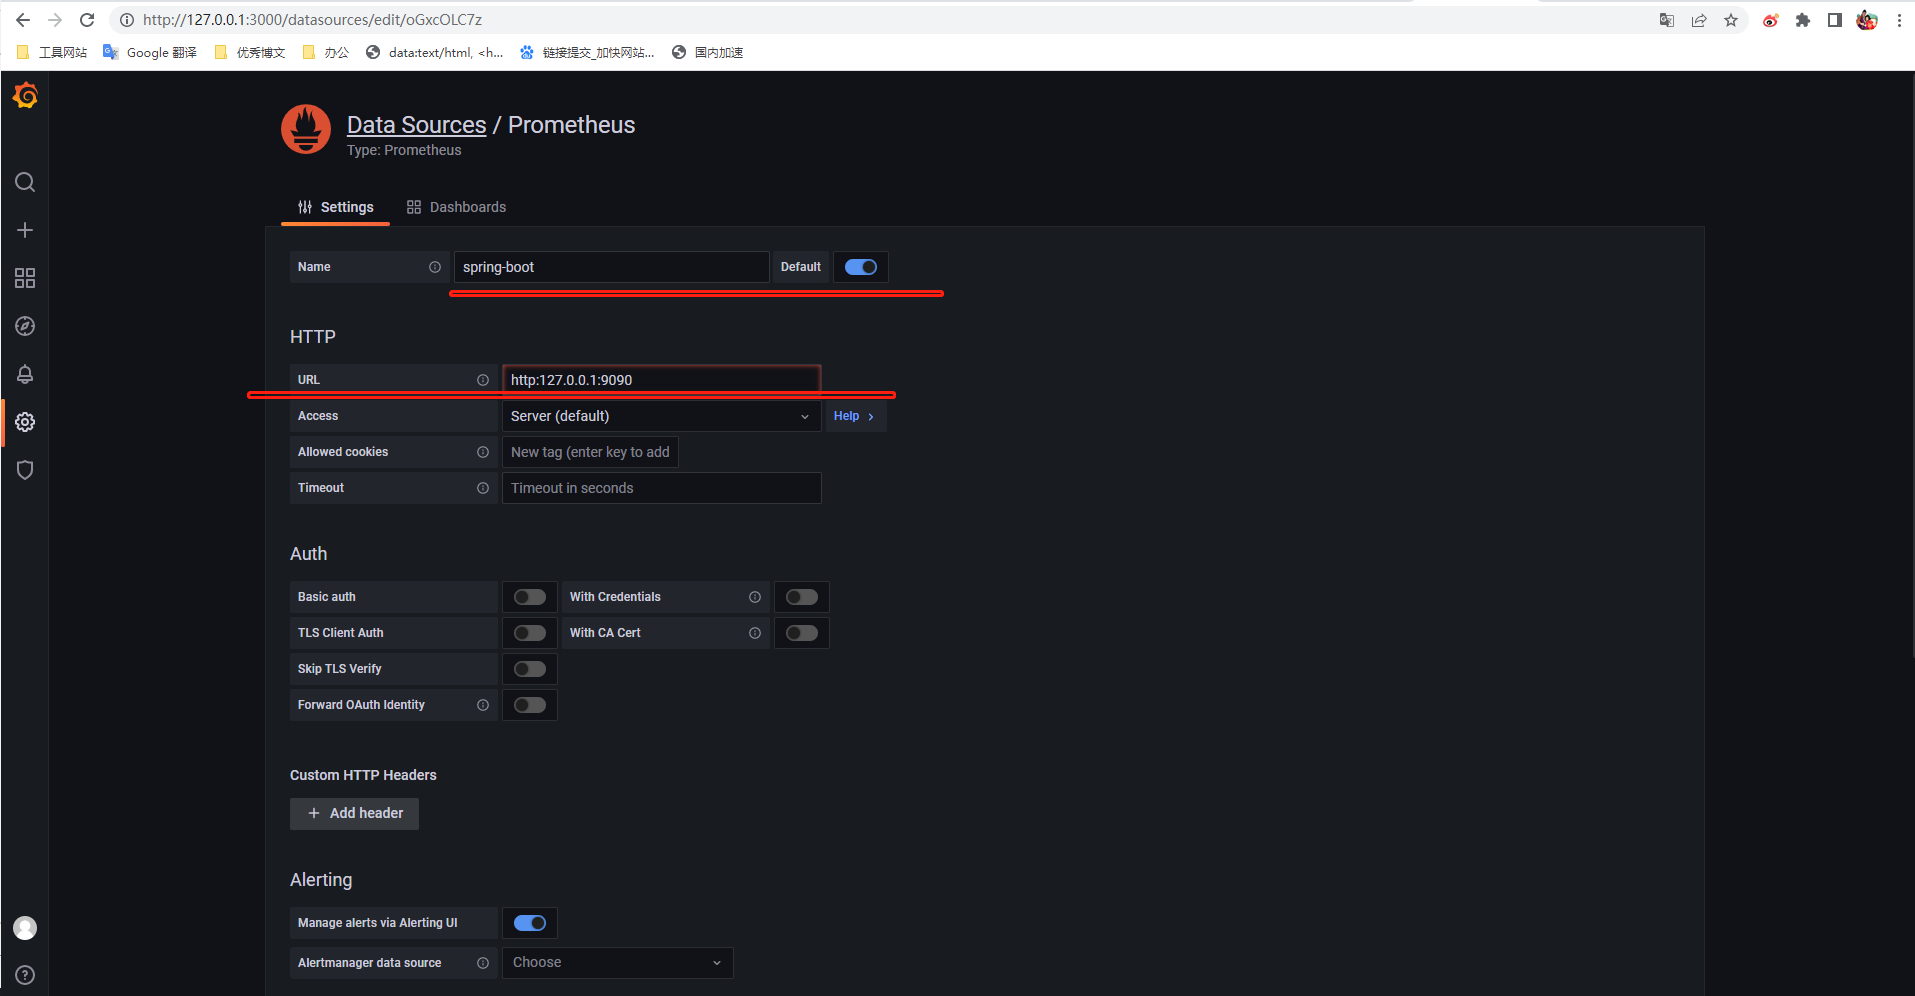
增加数据源
- Name填一个
- URL填的Prometheus访问地址
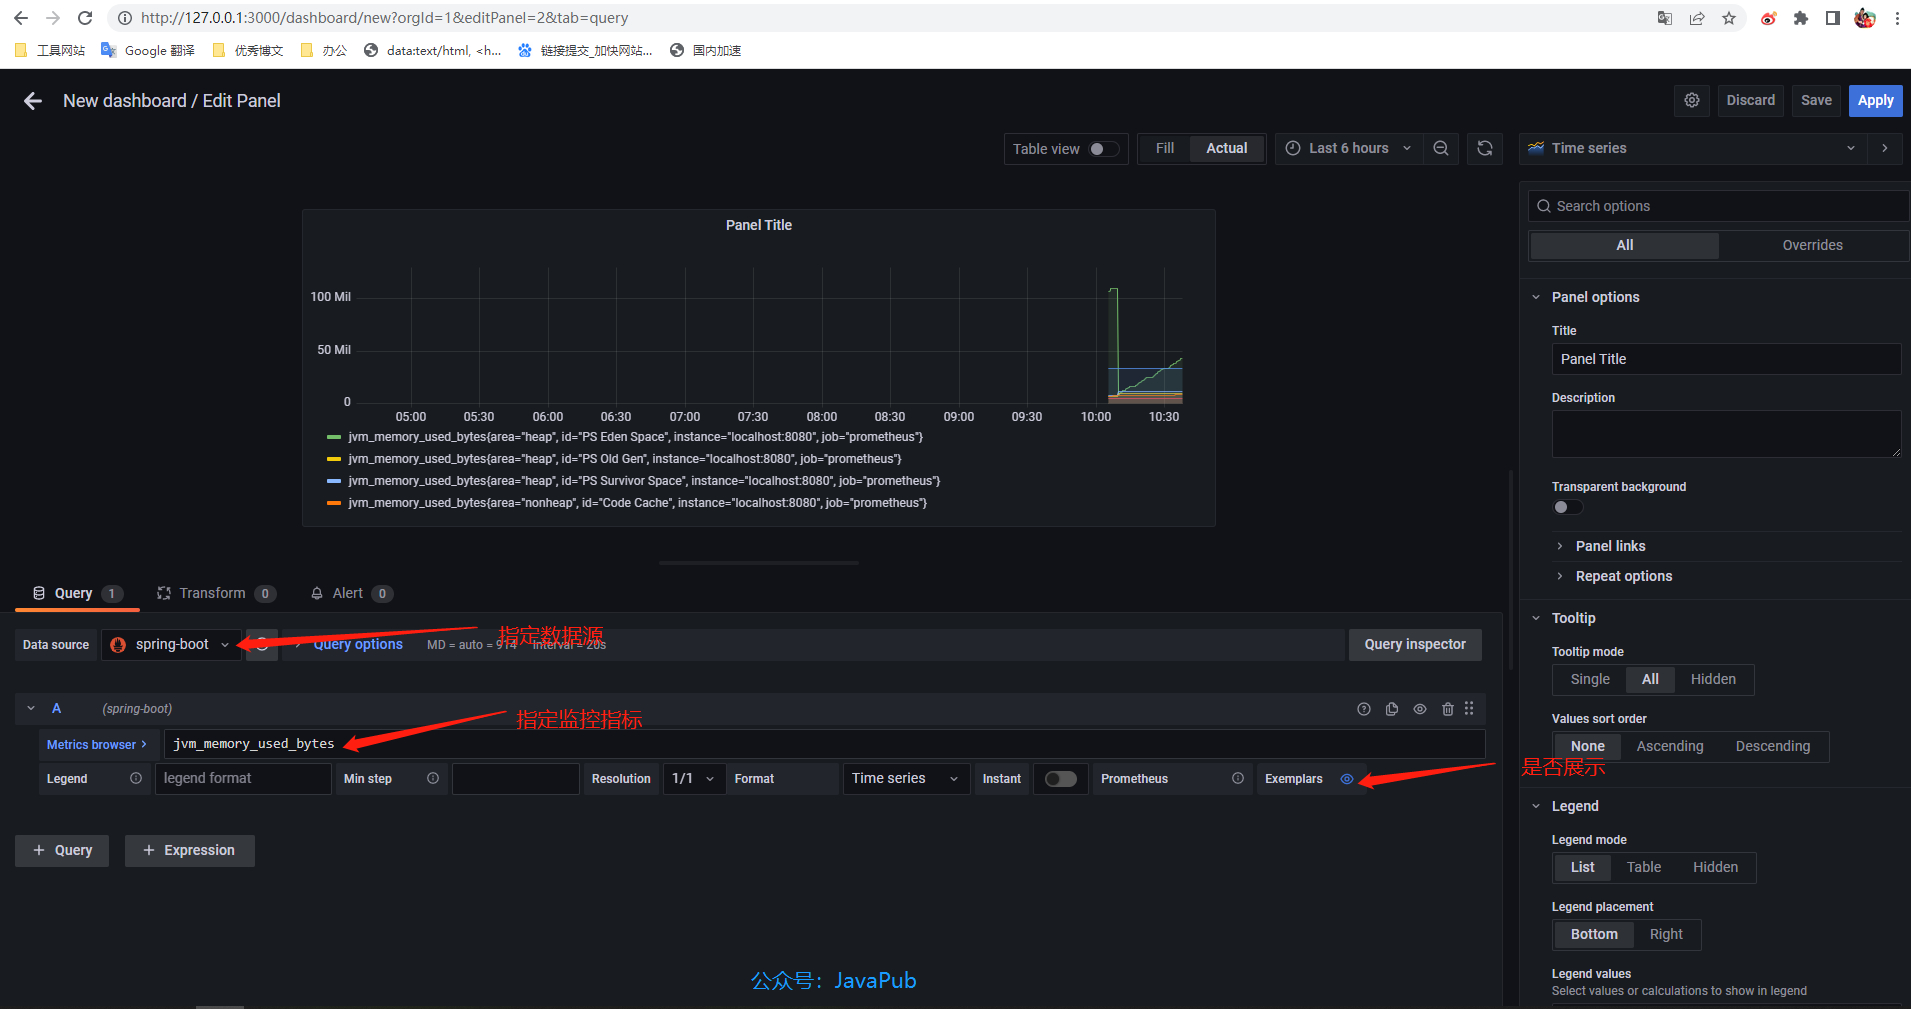
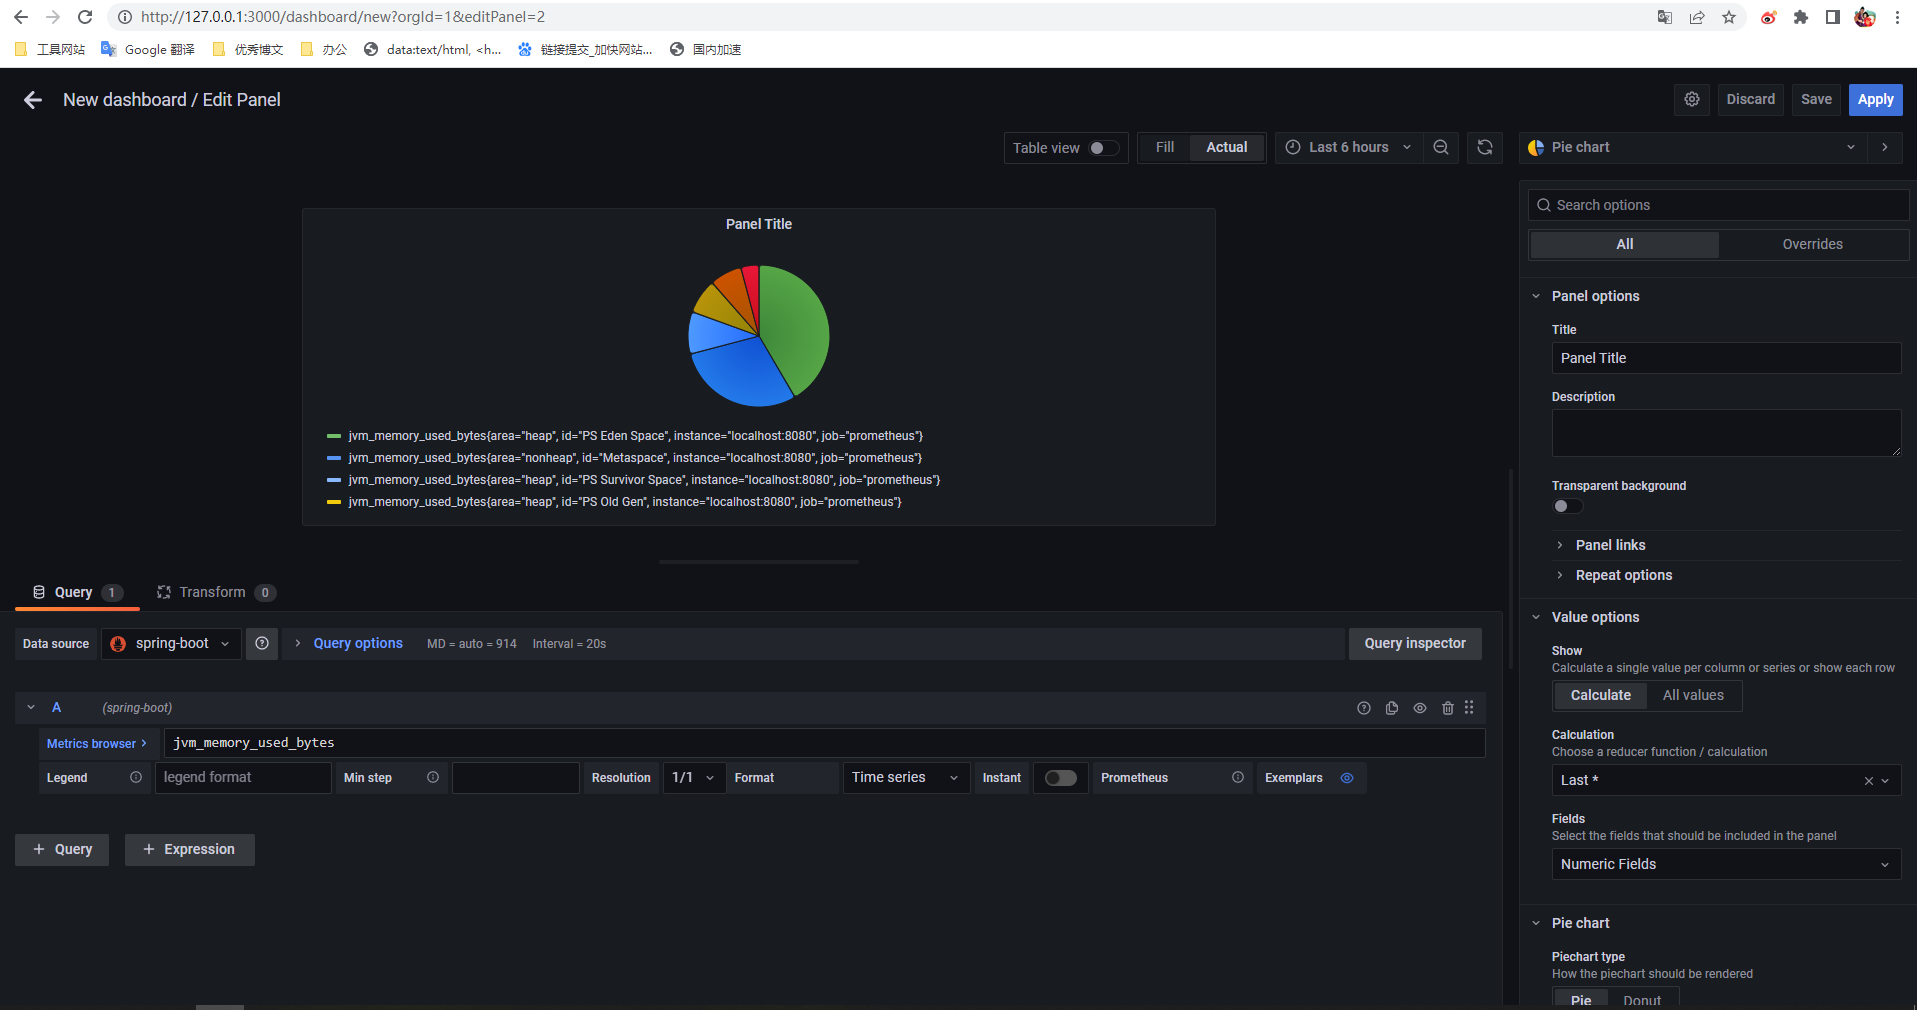
添加图表
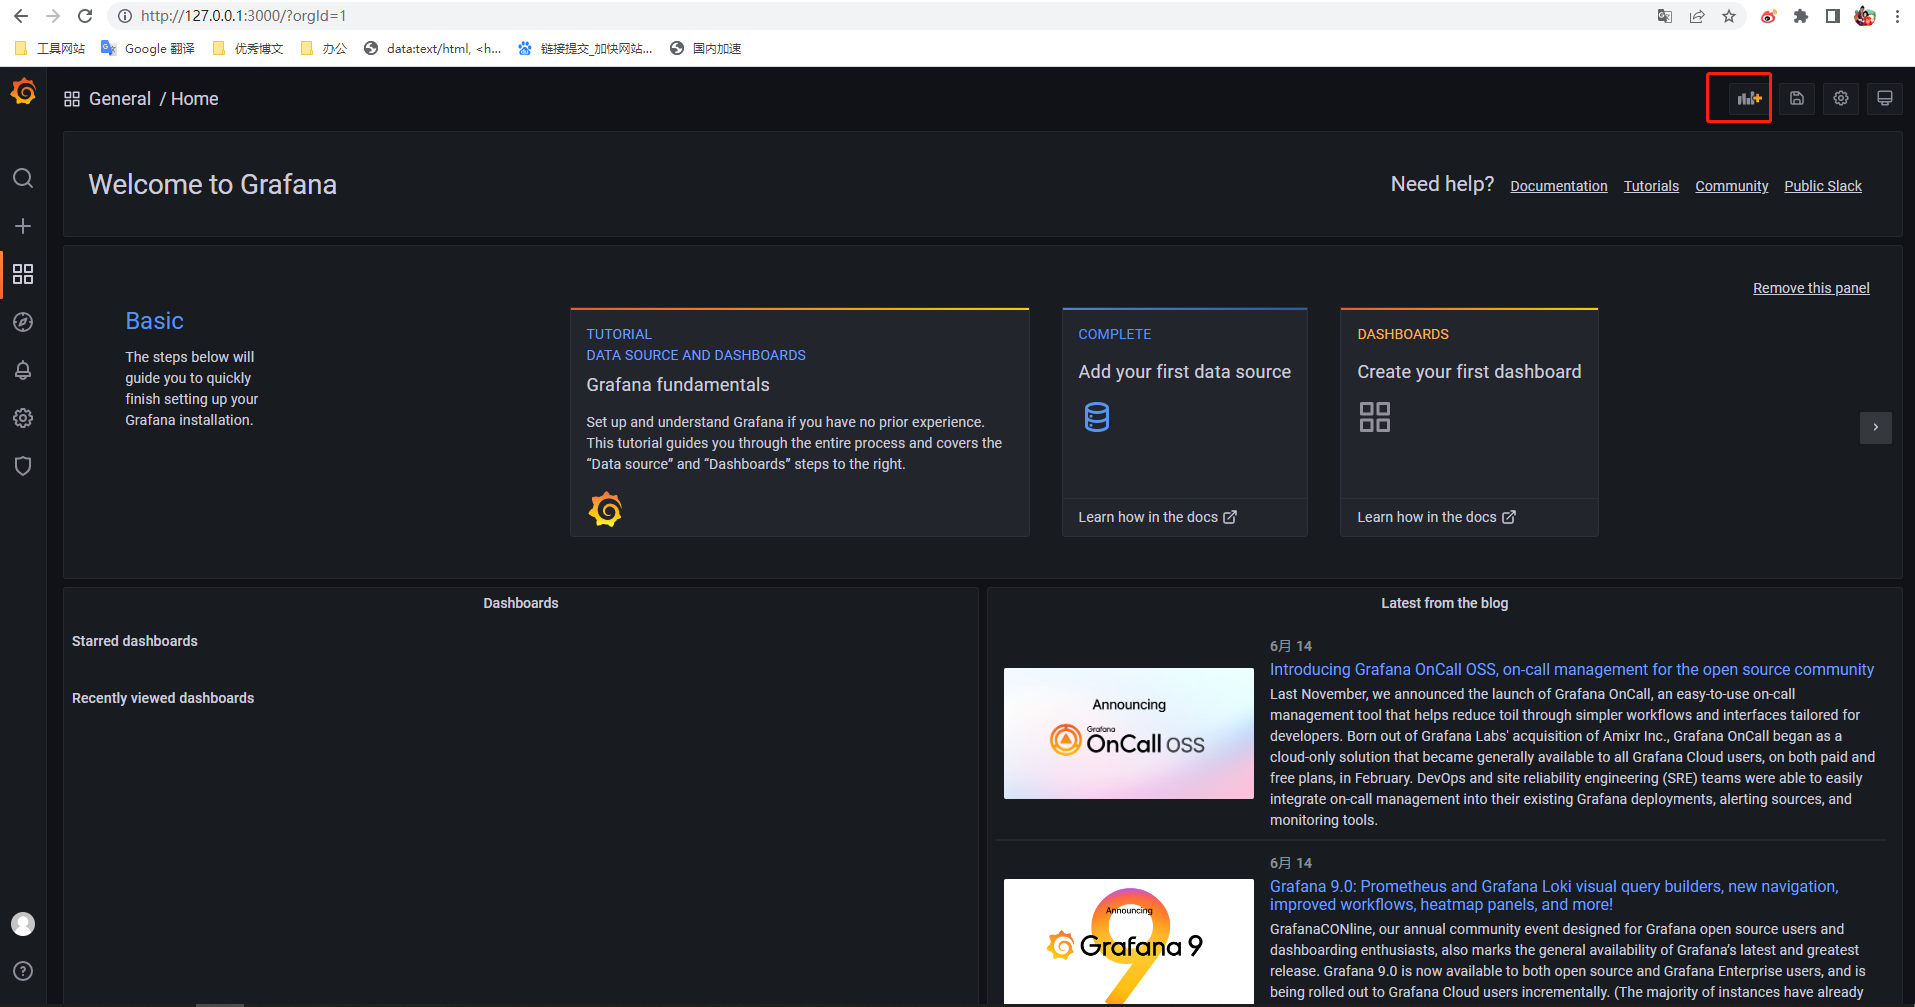
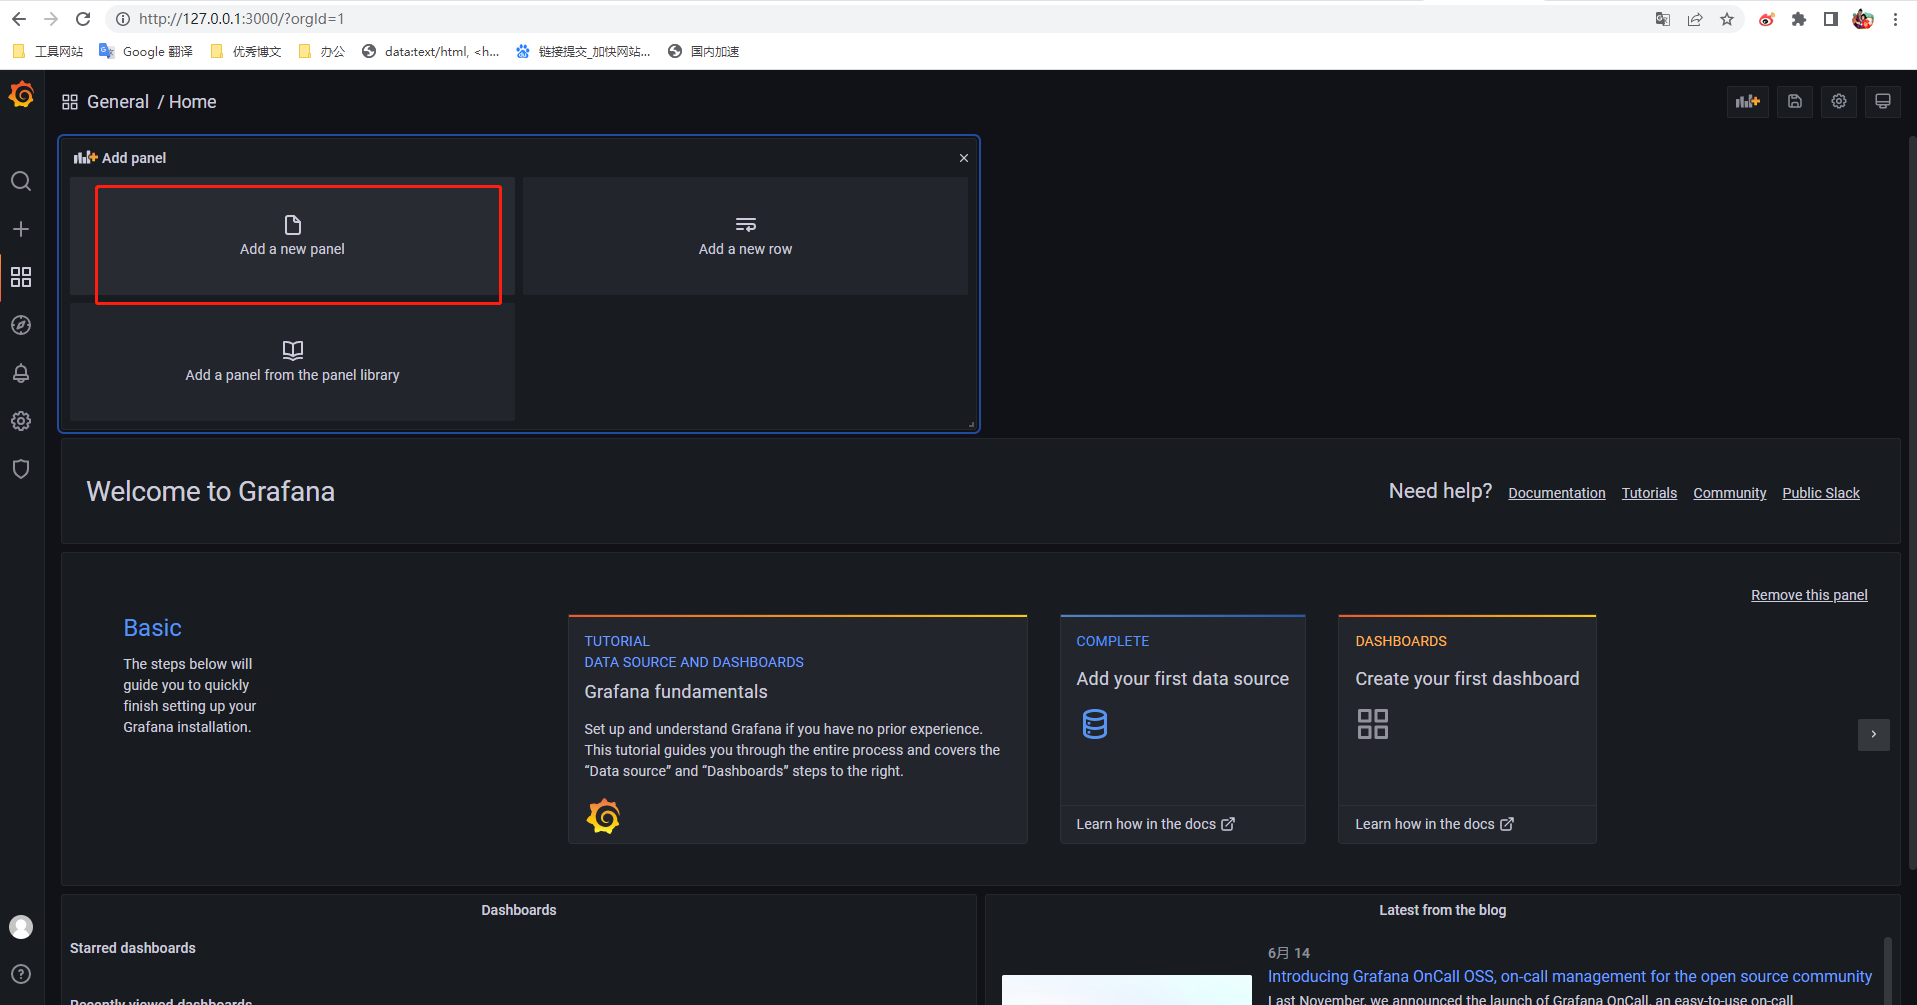
指定数据源、指定监控指标 jvm_memory_used_bytes
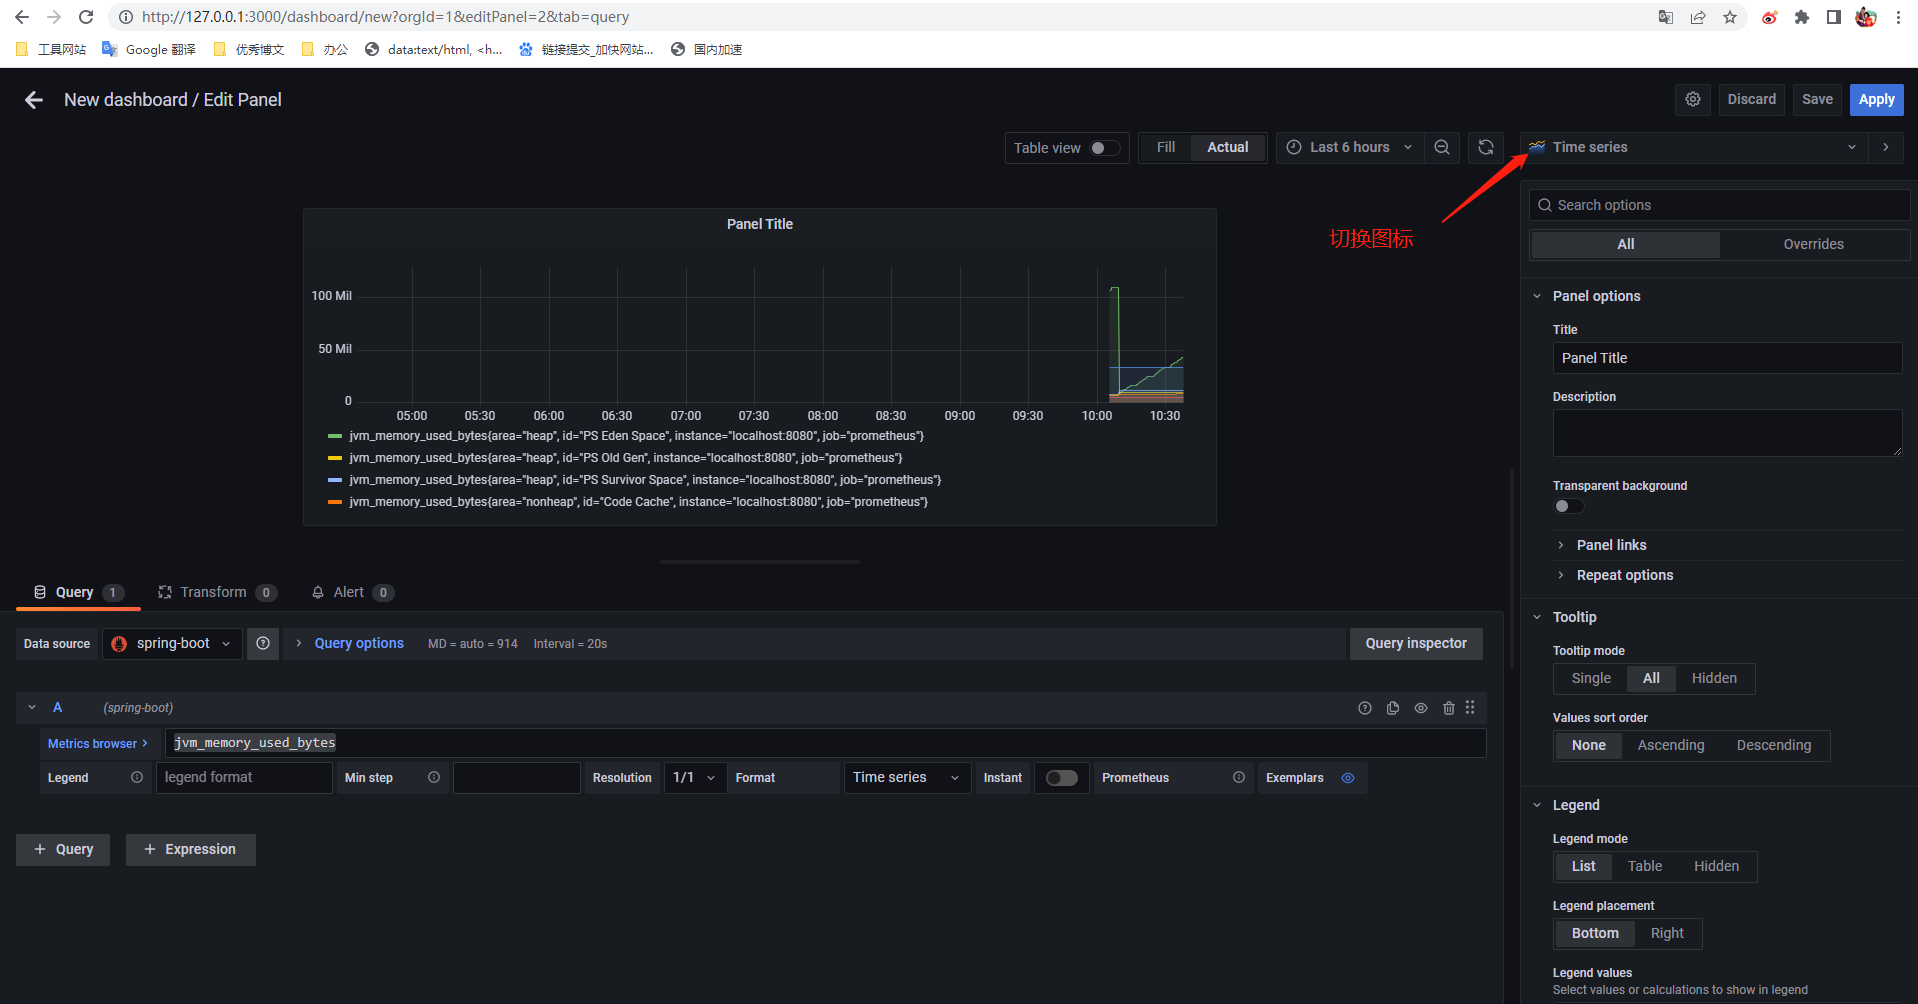
切换图标
源码地址:https://github.com/Rodert/spring-boot-prometheus-grafana
视频地址:https://space.bilibili.com/404747369
延伸阅读
- SpringBoot自定义注解
- SpringBoot整合docker入门
- SpringBoot整合ElasticSearch
- SpringBoot快速整合Excel
- SpringBoot整合MyBatis-支持批量更新
- SpringBoot实现链路追踪spring-boot-trace
- SpringBoot2.x整合Prometheus+Grafana【附源码】
中级篇
- 手把手整合SSM-Spring-Spring MVC-Mybatis
实战篇
- 通用后台管理系统
将支持:Activiti + Flowable 工作流; 第三方登录; 支付; 短信; 支持 RBAC 动态权限、数据权限;监接;商城。SpringBoot Spring Security JWT MyBatis Druid Vue Vuex Element-ui Axios Sass Quill docker-compose、Kafka

本文来自互联网用户投稿,文章观点仅代表作者本人,不代表本站立场,不承担相关法律责任。如若转载,请注明出处。 如若内容造成侵权/违法违规/事实不符,请点击【内容举报】进行投诉反馈!