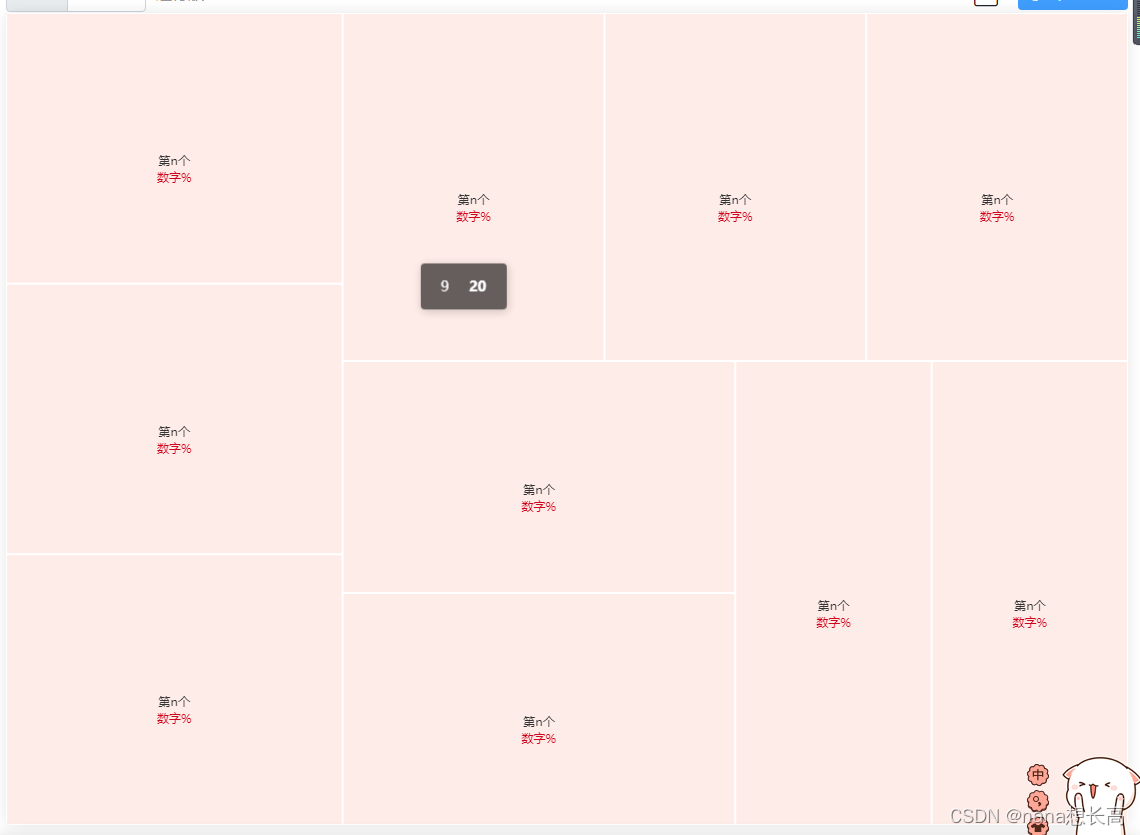
代码:
const dataArr = []
for(let i = 0; i < 10; i++) {const obj = {name: i,value: 20,label: {show: true,verticalAlign: 'top',align: 'center',formatter: function(params) {return ['{a|第n个}', '{b|数字%}'].join('\n')},rich: {a: {color: '#333',fontSize: 12,lineHeight: 17,align: 'center'},b: {color: '#d0021b',fontSize: 12,lineHeight: 17,align: 'center'}}},itemStyle: {borderWidth: 1,borderColor: '#fff',color: 'rgba(242,71,36,0.1)'}}dataArr.push(obj)
}option = {tooltip: {show: true,padding: [16, 20],backgroundColor: 'rgba(0,0,0,0.6)',borderWidth: 0,textStyle: {fontSize: 14,color: '#fff',lineHeight: 14}},series: [{type: 'treemap',width: '100%',height: '100%',breadcrumb: {show: false},nodeClick: false,roam: false,data: dataArr}]}
最终效果:
本文来自互联网用户投稿,文章观点仅代表作者本人,不代表本站立场,不承担相关法律责任。如若转载,请注明出处。 如若内容造成侵权/违法违规/事实不符,请点击【内容举报】进行投诉反馈!
