Matplotlab画CDF图
画图效果
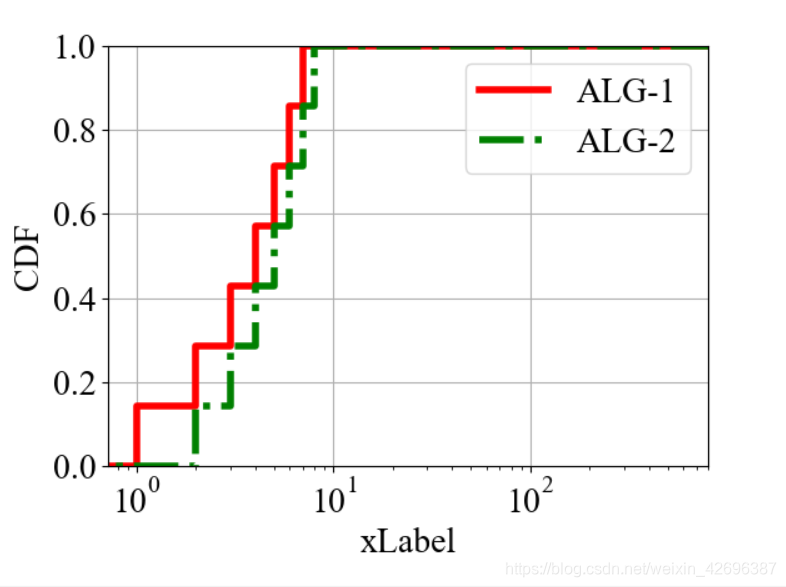
CDF画图举例
# encoding=utf-8import matplotlib.pyplot as plt
import numpy as np
import matplotlib
import copy"""
Devl env: python3, matplotlib;
Developer: zengyue;
Encoding: utf-8.
"""class Draw():"""Function: Draw line chart, bar chart, column chart, cumulative distribution function chart."""def __init__(self, fig_type='eps', font_family='Times New Roman', font_size=20, fig_size = (6.4,4.8), line_width=4, fig_left=0.15, fig_right=0.9, fig_top=0.9, fig_bottom= 0.2 , agg_fig=False, show_fig=True, show_grid=True, show_title=False):# resetmatplotlib.use('TkAgg')#record figure typself.fig_type = fig_type#set fix paramenters: color, mec, marer, marker, hatch, line styleself.colors = ['red', 'green', 'blue', 'cyan', 'magenta', 'yellow', 'black', 'white']   #default colorsself.mecs = self.colors     #the edge color of markersself.mfcs = 'white'     #the interner color of markersself.edge_color = 'white'self.markers = ['o', '^', '.', '*', '-', '+', 'x', 'O']     #markers on each lineself.hatchs = self.markers  #hatchesself.line_style = ['-', '-.', ':', '--', '-:']#setting default paramentersplt.rcParams['font.family'] = 'Times New Roman'plt.rcParams['font.size'] = font_sizeplt.rcParams['figure.figsize'] = fig_sizeplt.rcParams['lines.linewidth'] = line_widthplt.rcParams['figure.subplot.left'] = fig_leftplt.rcParams['figure.subplot.right'] = fig_rightplt.rcParams['figure.subplot.top'] = fig_topplt.rcParams['figure.subplot.bottom'] = fig_bottom#show or notself.show_fig = show_figself.show_grid = show_gridself.show_title = show_title#enable execution on systems without a GUI graphical interfaceif agg_fig:plt.switch_backend('agg')def cdfChart(self, xData, yData, lineLabels, figName, xLabel, yLabel='CDF', xLowBound=0, xUpBound=100, yLowBound=0, yUpBound=1):ax=plt.gca()ax.set_xscale('log')len_data = len(xData)#'''for i in range(0,len_data):#insert start value#xData[i].insert(0,0)#yData[i].insert(0,0)#insert end valuexData[i].append(xUpBound)yData[i].append(1)print(i,len(xData[i]),len(yData[i]))#'''for i in range(0,len_data):plt.plot(xData[i], yData[i], linestyle=self.line_style[i], color=self.colors[i], drawstyle='steps-post', label=lineLabels[i])plt.xlim(xLowBound, xUpBound)plt.ylim(yLowBound, yUpBound)plt.xlabel(xLabel)plt.ylabel(yLabel)plt.xticks()  plt.yticks()plt.legend()plt.grid(self.show_grid)if self.show_title:plt.title(title_name, fontsize=self.font_size)plt.savefig(figName+"."+self.fig_type)if self.show_fig:plt.show()plt.close()def cdfExample():#initiatenewDraw = Draw(agg_fig=False)#CDF chart examplelineLabels = ['ALG-1','ALG-2']xdata1 = [1,2,3,4,5,6,7]xdata2 = [2,3,4,5,6,7,8]xData = []xData.append(xdata1)xData.append(xdata2)yData = []for i in range(0,len(xData)):data = []for j in range(1,len(xData[i])+1):data.append(j/len(xData[i]))yData.append(data)for i in range(0,len(xData)):xData[i].insert(0,0)yData[i].insert(0,0)newDraw.cdfChart(xData, yData, lineLabels=lineLabels, figName="Fig-Default", xLabel="xLabel", yLabel='CDF', xLowBound=0, xUpBound=100*max(xdata2), yLowBound=0, yUpBound=1)if __name__=='__main__':cdfExample()
本文来自互联网用户投稿,文章观点仅代表作者本人,不代表本站立场,不承担相关法律责任。如若转载,请注明出处。 如若内容造成侵权/违法违规/事实不符,请点击【内容举报】进行投诉反馈!